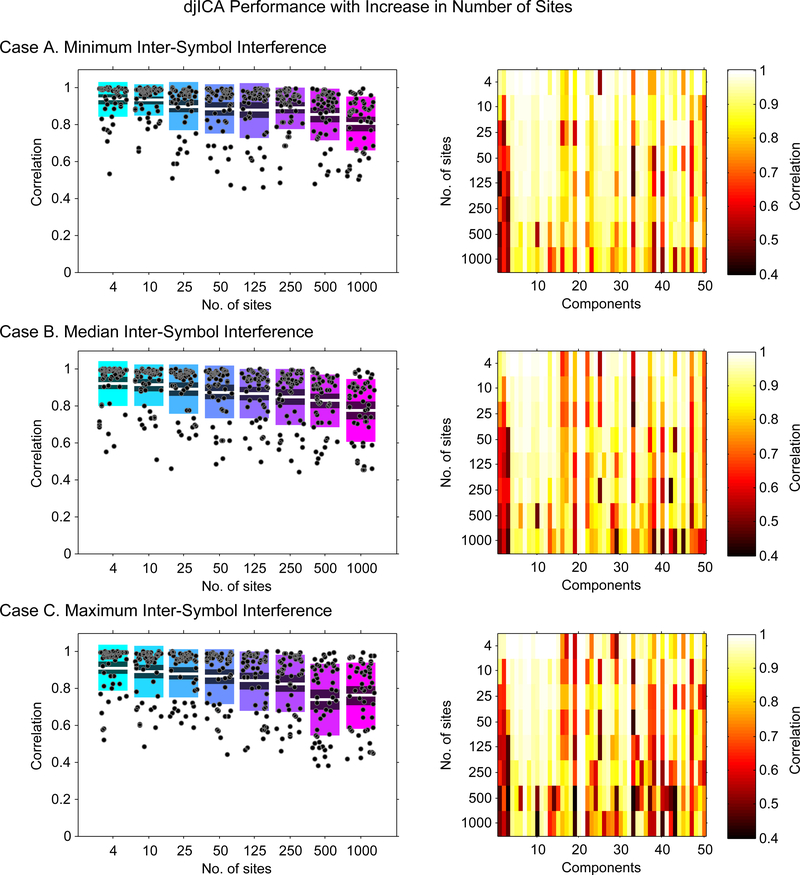
Figure 4:
Keeping the number of subjects fixed at 2000, and increasing the number of sites, we examine the correlations of the estimated components from djICA with the reference component being the corresponding best match from the pooled ICA case. We plot the correlations for the estimations from runs with the minimum, maximum, and median ISI selected out of 10 total runs.

