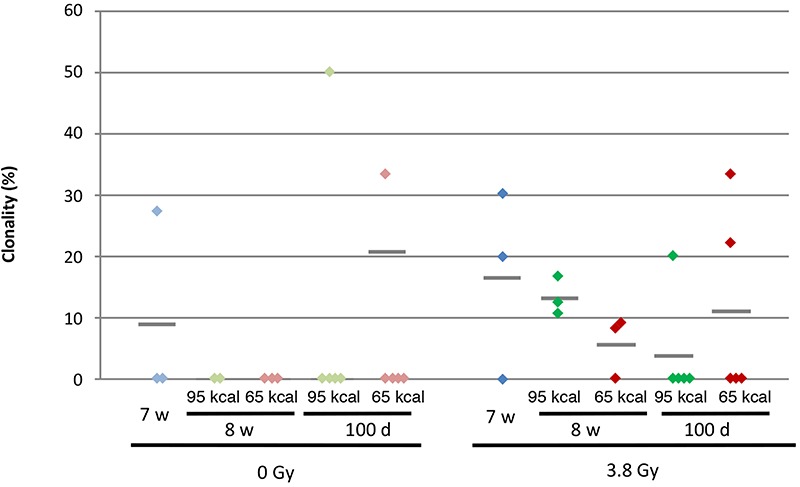
Fig. 3.

Mutation clonality at the gpt gene in the spleen of gpt delta mice. The results presented in Table 1 are plotted. Diamonds (green: 95 kcal/week; red: 65 kcal/week) represent the clonality of an individual mouse, and grey bars represent the average clonalities of the groups.
