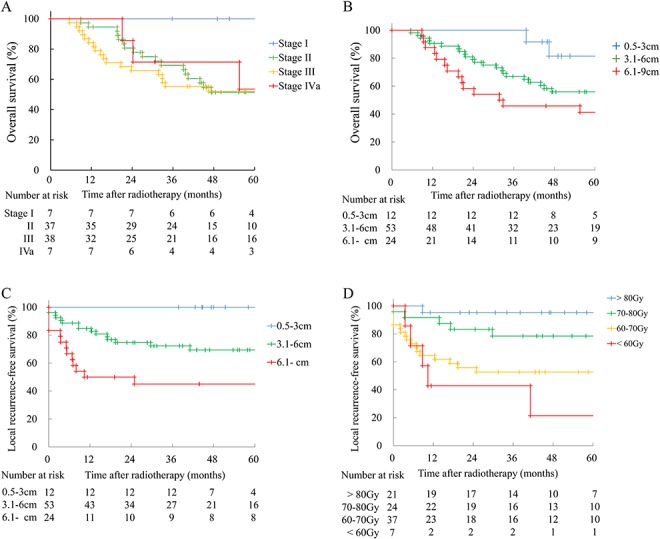
Fig. 1.

Overall survival and local recurrence-free survival rates. (A) Overall survival according to FIGO stage. Numbers at risk are shown below the Kaplan-Meier curves. (B) Overall survival stratified by pretreatment tumor diameter. (C) Local recurrence-free survival stratified by pretreatment tumor diameter. (D) Local recurrence-free survival stratified by EQD2 of the HR-CTV D90.
