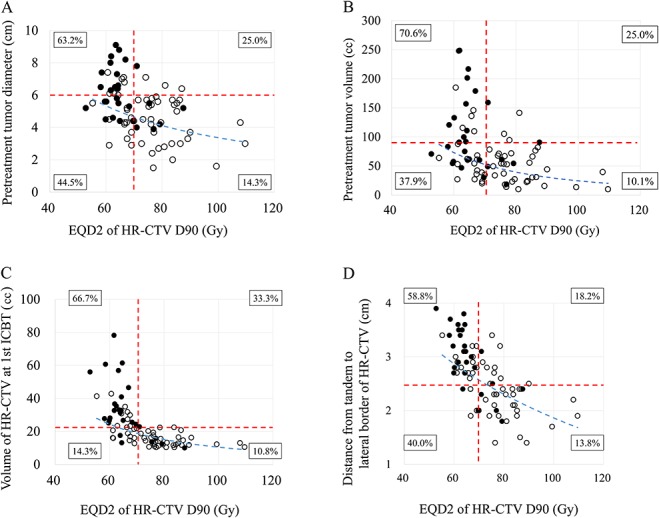
Fig. 2.

(A) Relationship between EQD2 of the HR-CTV D90 and pretreatment tumor diameter. Closed circles represent patients with local recurrence and open circles indicate patients without recurrence. Red dotted lines show cut-off values of 6 cm (horizontal) and 70 Gy (vertical). The blue dotted line is the regression curve. There was a significant negative correlation between EQD2 of the HR-CTV D90 and pretreatment tumor diameter (r = −0.459, P < 0.001). Percentages in boxes indicate the local recurrence rate for each quadrant. (B) Relationship between EQD2 of the HR-CTV D90 and pretreatment tumor volume. Closed circles represent patients with local recurrence and open circles indicate patients without recurrence. Red dotted lines show cut-off values of 90 cc (horizontal) and 70 Gy (vertical). The blue dotted line is the regression curve. There was a significant negative correlation between EQD2 of the HR-CTV D90 and pretreatment tumor volume (r = −0.513, P < 0.001). Percentages in boxes indicate the local recurrence rate for each quadrant. (C) Relationship between EQD2 of the HR-CTV D90 and the HR-CTV volume at first ICBT. Closed circles indicate patients with local recurrence and open circles represent patients without recurrence. Red dotted lines show cut-off values of 22 cc (horizontal) and 70 Gy (vertical). The blue dotted line is the regression curve. A significant negative correlation was noted between EQD2 of the HR-CTV D90 and the HR-CTV volume at first ICBT (r = −0.713, P < 0.001). Percentages in boxes indicate the local recurrence rate for each quadrant. (D)Relationship between EQD2 of the HR-CTV D90 and the distance from tandem to the lateral border of the HR-CTV. Closed circles represent patients with local recurrence and open circles are for patients without recurrence. Red dotted lines indicate cut-off values of 2.5 cm (horizontal) and 70 Gy (vertical). The blue dotted line shows the regression curve. A negative correlation was recognized between EQD2 of the HR-CTV D90 and the distance from tandem to the lateral border of the HR-CTV (r = − 0.685, P < 0.001). Percentages in boxes indicate the local recurrence rate for each quadrant.
