
Fig. 1.
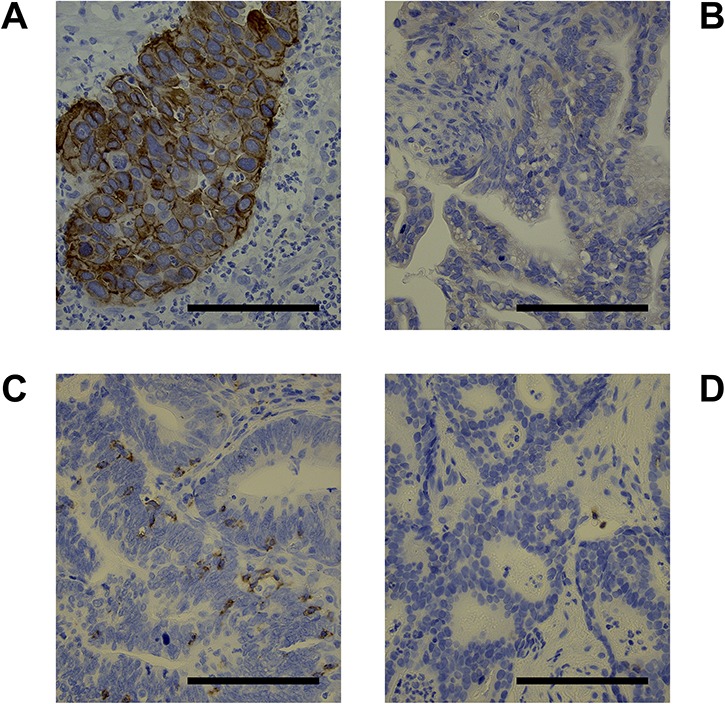
Representative images showing (A) positive staining of the tumor cell membrane for programmed death-ligand 1 (PD-L1), (B) negative staining for PD-L1, (C) positive staining for CD8, and (D) negative staining for CD8 (×300). The scale bar is 100 μm.