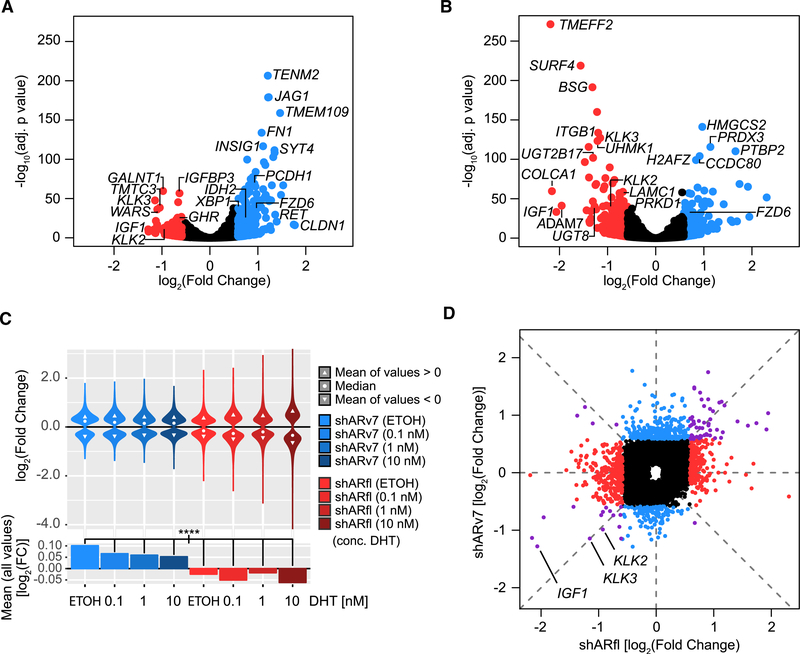
Figure 2. ARv7, Unlike ARfl, Functions as a Transcriptional Repressor in CRPC Cells.
(A and B) Volcano plots of differentially expressed genes in shARv7 (A) or shARfl (B) cells, compared with shGFP control. Significantly altered genes (fold change >±1.5; adjusted p value <0.05) are highlighted in red (activated) or blue (repressed). Select AR targets and significant outliers are labeled.
(C) Top: violin plots of log2 fold changes of ARv7-regulated (blue) and ARfl-regulated (red) genes (relative to the shGFP control) in response to DHT stimulation. Only genes with an adjusted p value of <0.05 are shown. Bottom: bar plots of the mean log2 fold changes of the ARv7-regulated (blue) and ARfl-regulated (red) target genes as above. ****p % 0.0001 by ANOVA and Tukey’s honest significant difference test (HSD).
(D) Comparison of log2 fold changes of significantly dysregulated genes (adjusted p value <0.05) in response to shARv7 or shARfl (as defined in A and B). Colors indicate genes primarily dysregulated by shARfl (red), shARv7 (blue), or both (purple). Select classical AR targets are labeled.

