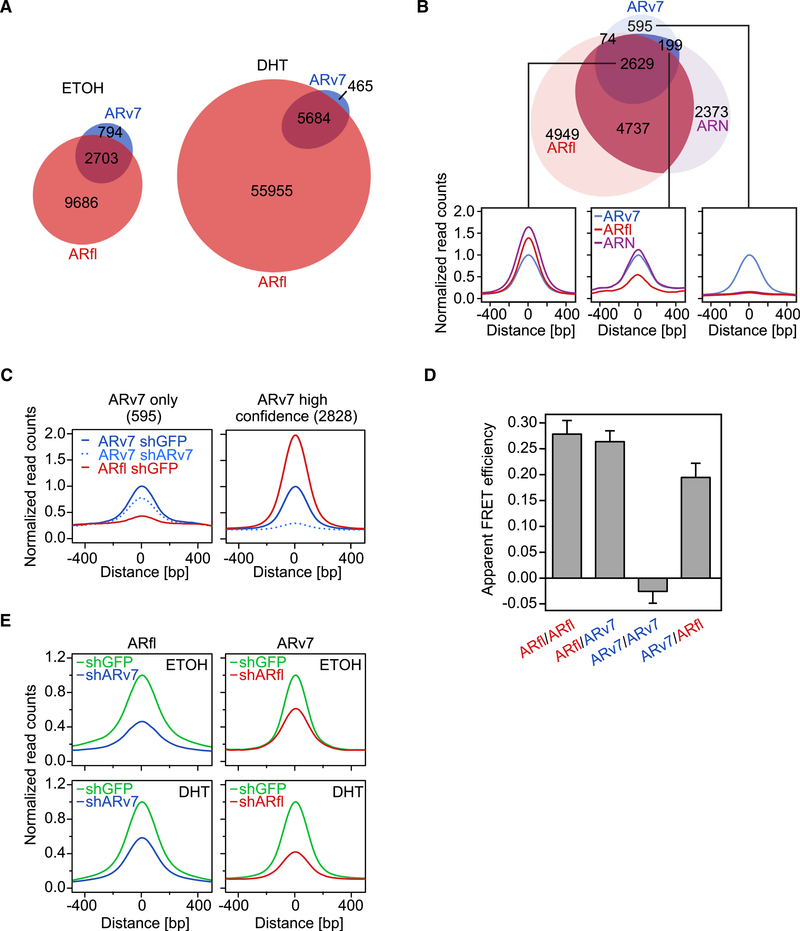
Figure 3. ARfl and ARv7 Binding to Chromatin Is Interdependent.
(A) Euler diagram of the overlap (R1 bp) of ARv7 (blue) and ARfl (red) cistromes, profiled in the absence of hormone (ETOH) or after 4 h of DHT (10 nM) treatment. The numbers of unique and overlapping binding sites are indicated.
(B) Top: Euler diagram of the overlap of ARv7 (blue), ARfl (red), and AR N-terminal cistromes (ARN; purple) in the absence of hormone. Bottom: signal profiles (500-bp interval around the center of ARv7 peaks) of ARv7, ARfl, and ARN cistromes at different ARv7-binding sites. Left panel: 2,629 ARv7, ARfl, and ARN shared peaks. Middle panel: 199 ARv7 and ARN shared peaks. Right panel: 595 “ARv7-unique” peaks.
(C) Signal profiles of ARv7 (blue) and ARfl (red) cistromes in response to ARv7 (shARv7; dashed line) or GFP KD (shGFP; solid lines) at “ARv7-unique” (left) or “high confidence” AR sites (union of ARN, Arv7, and ARfl peaks) (right).
(D) Apparent FRET efficiencies representative of the level of AR isoform interactions, as shown. Values are the mean of 34–48 cells ±SEM.
(E) Signal profiles of ARfl (left) and ARv7 (right) cistromes centered on AR isoform peaks. Cells were induced for 3 days and treated for 4 h with vehicle (ETOH) or 10 nM DHT (DHT).

