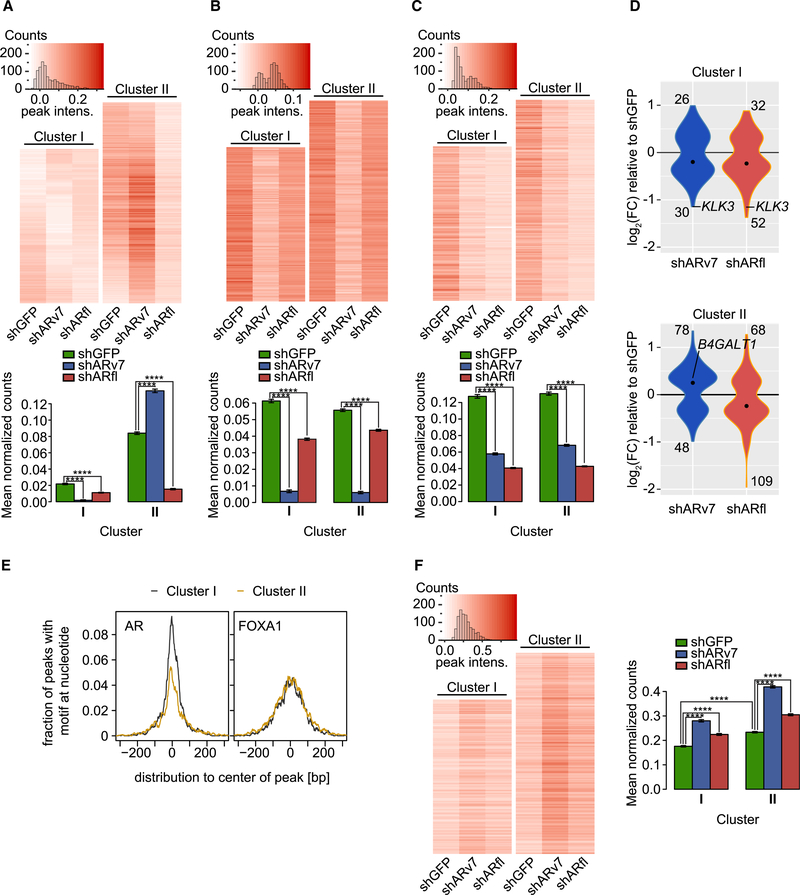
Figure 5. ARv7 Negatively Regulates H3K27ac and FOXA1 Chromatin Binding.
(A–C) Top: heatmaps of H3K27ac (A), ARv7 (B), and ARfl ChIP-seq (C) in indicated cells, depicting only signals for AR “high-confidence” binding sites (union of ARN, Arv7, and ARfl peaks). Clusters (I and II) are based on the H3K27ac data. Bottom: bar graphs of the average normalized ChIP-seq counts, as indicated. Data are the mean of each cell line data within each cluster ±SEM (cluster I, n = 3,284 peaks; cluster II, n = 4,268 peaks). ****p < 0.0001 by ANOVA and Tukey’s HSD.
(D) Violin plots of the differentially expressed (adjusted p value <0.05) ARv7-target (blue) and ARfl-target (red) genes (within 10 kb of an AR site). The number of up- and downregulated genes and median values (black dot) are shown. The Fisher’s exact test between clusters has a p = 0.074 for shARv7 and p = 1 for shARfl.
(E) Histogram of the fraction of ChIP-seq peaks in clusters I and II from (A) that contain an AR-binding (left) or FOXA1-binding motif (right).
(F) Heatmaps (left) and bar graphs (right) for FOXA1 ChIP-seq in indicated cell lines and clusters, as in (A) to (C).

