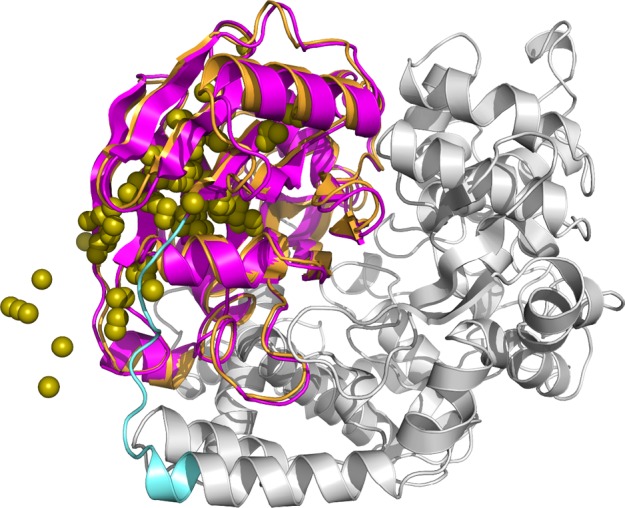
Figure 5.

Native protein structure of PDB ID: 1AOR and center of gravity for top 100 ligands in docking score. Gray indicates the receptor domain of 1AOR, magenta indicates the native ligand domain, orange indicates top 1 ligand structure model predicted by PINE, cyan indicates the linker region, and yellow spheres indicate the center of gravity of the top 100 ligand models generated by initial docking.
