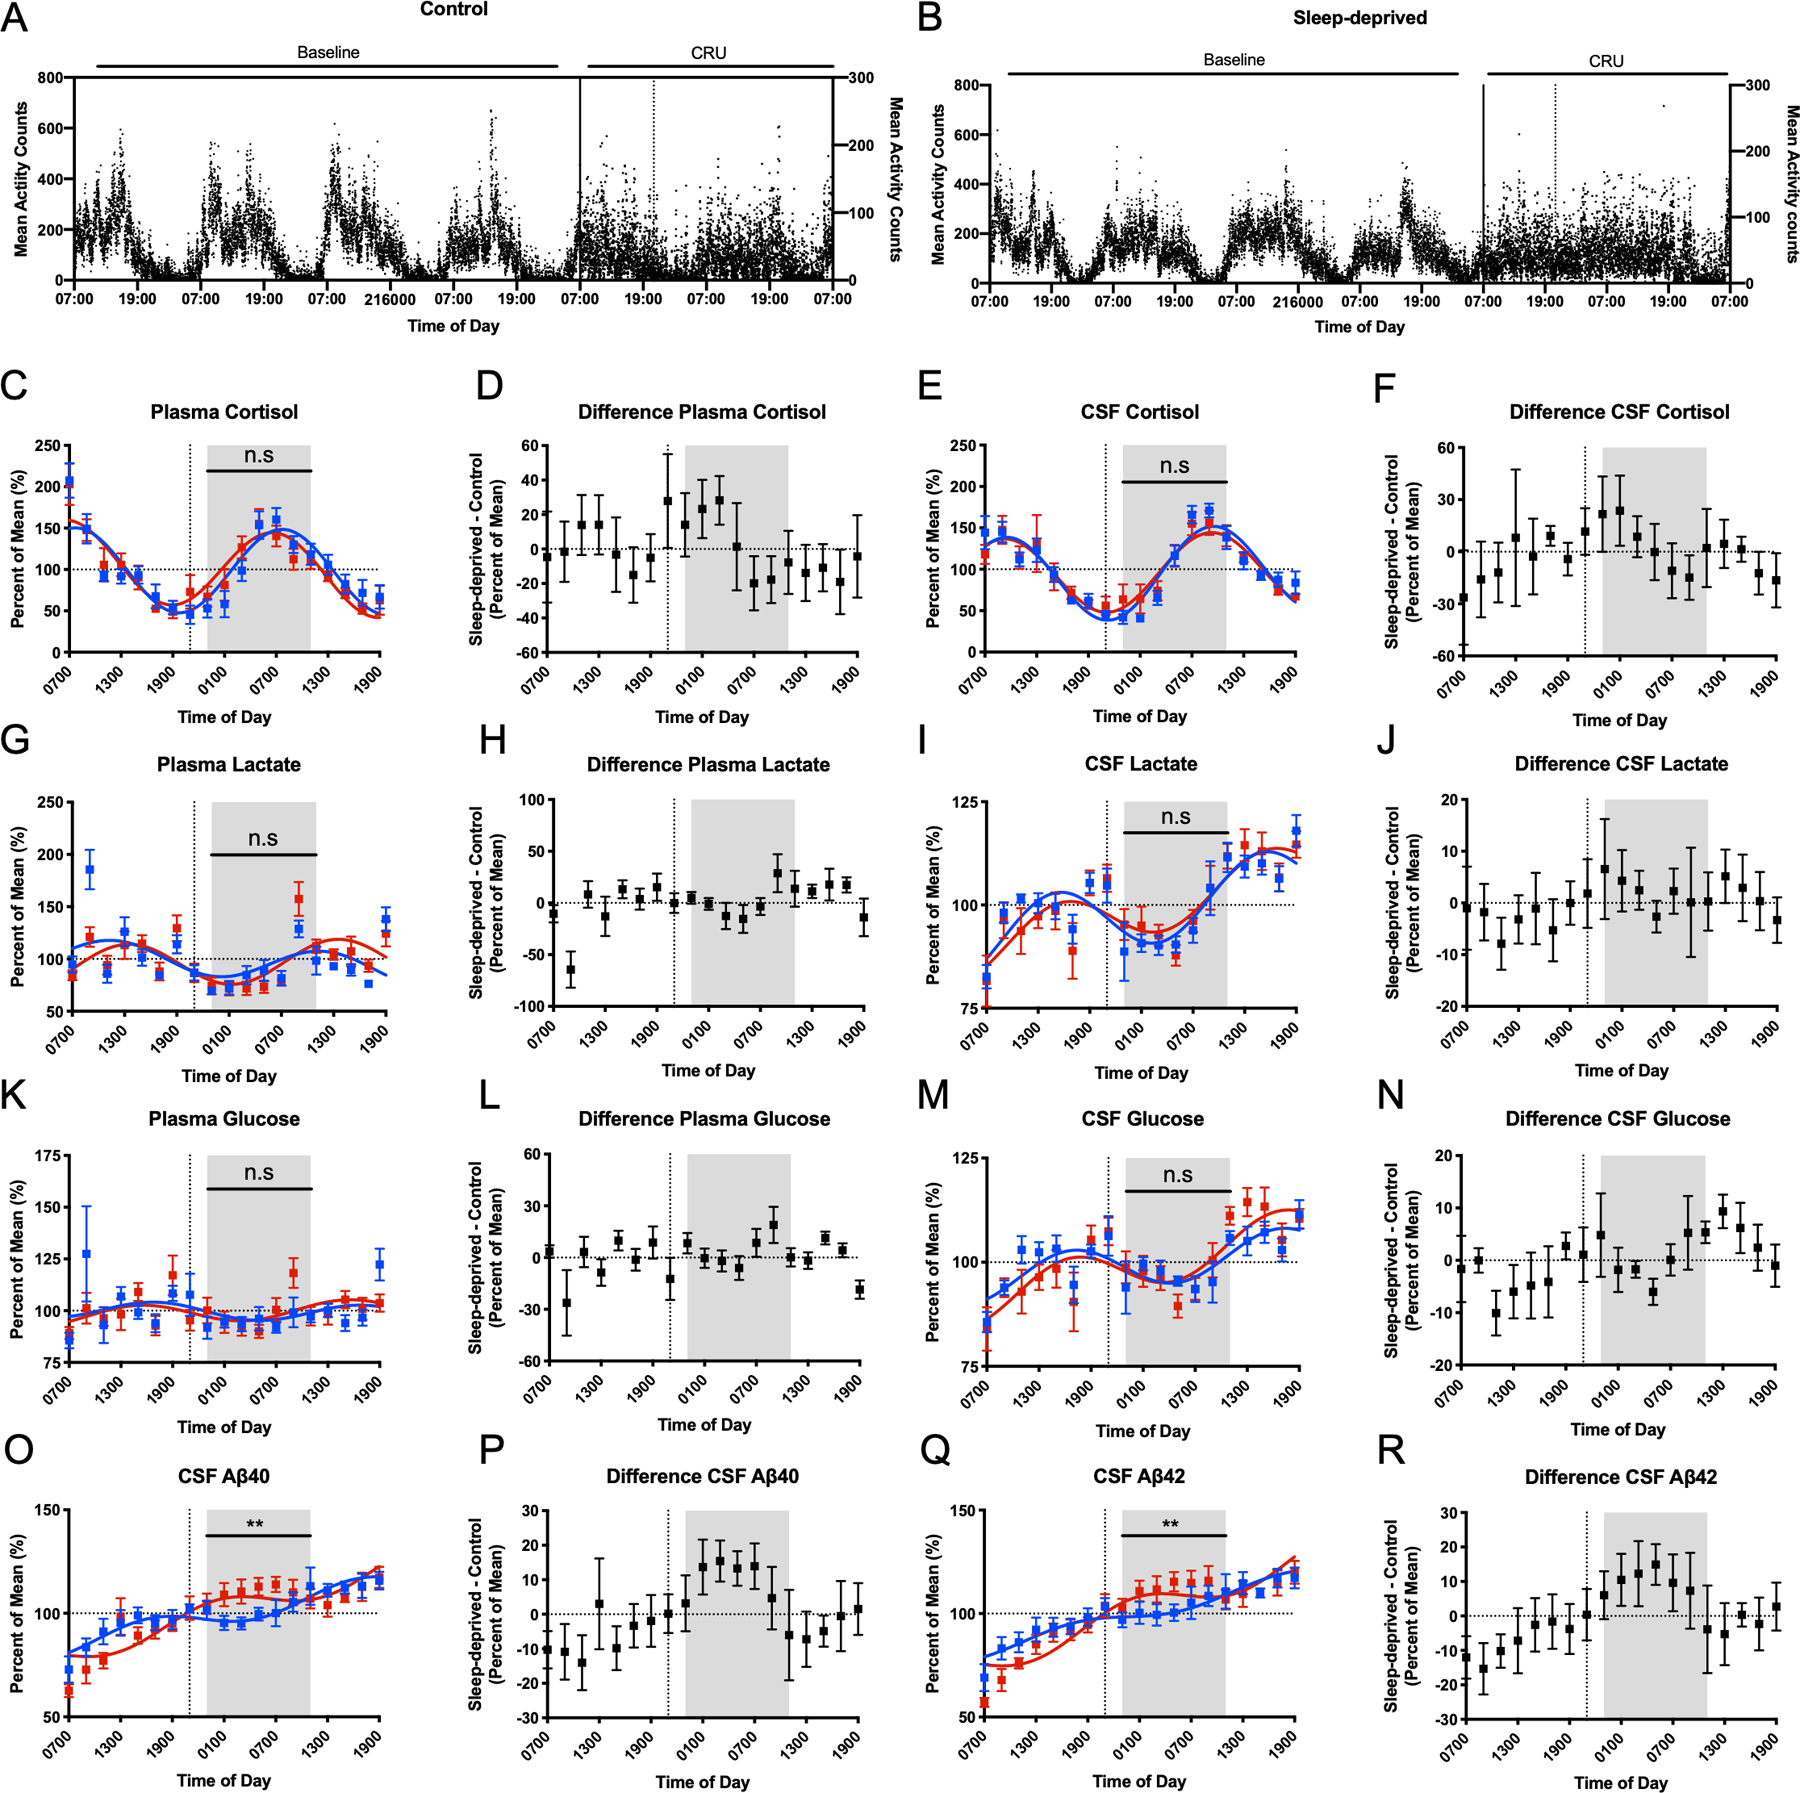
Figure 1:

Participant activity levels and time courses for CSF and plasma cortisol, lactate, glucose, and Aβ over 36-hours. Baseline mean activity counts from actigraphy monitoring over 4 days preceding admission to the CRU and during the admission for the control group (A) and sleep-deprived group (B). All concentrations for cortisol, lactate, glucose, and Aβ were normalized to percent of the mean before analysis. The shaded area indicates a 12-hour overnight period, 23:00–11:00. Vertical dashed lines show the start of the intervention. Cosinor fits and differences between sleep-deprived and control participants are shown in plasma and CSF for cortisol (C-F), lactate (G-J), and glucose (K-N). Concentrations of CSF Aβ40 and Aβ42 (O-R) collected over 36 hours for the control and sleep-deprived participants. Concentrations were significantly elevated in sleep-deprived group from 23:00 to 11:00 on day 2. (**p<0.01. n.s: not significant. Error bars show standard error. Blue=control. Red=sleep-deprived. Aβ: amyloid-β; CSF: cerebrospinal fluid; CRU: clinical research unit)
