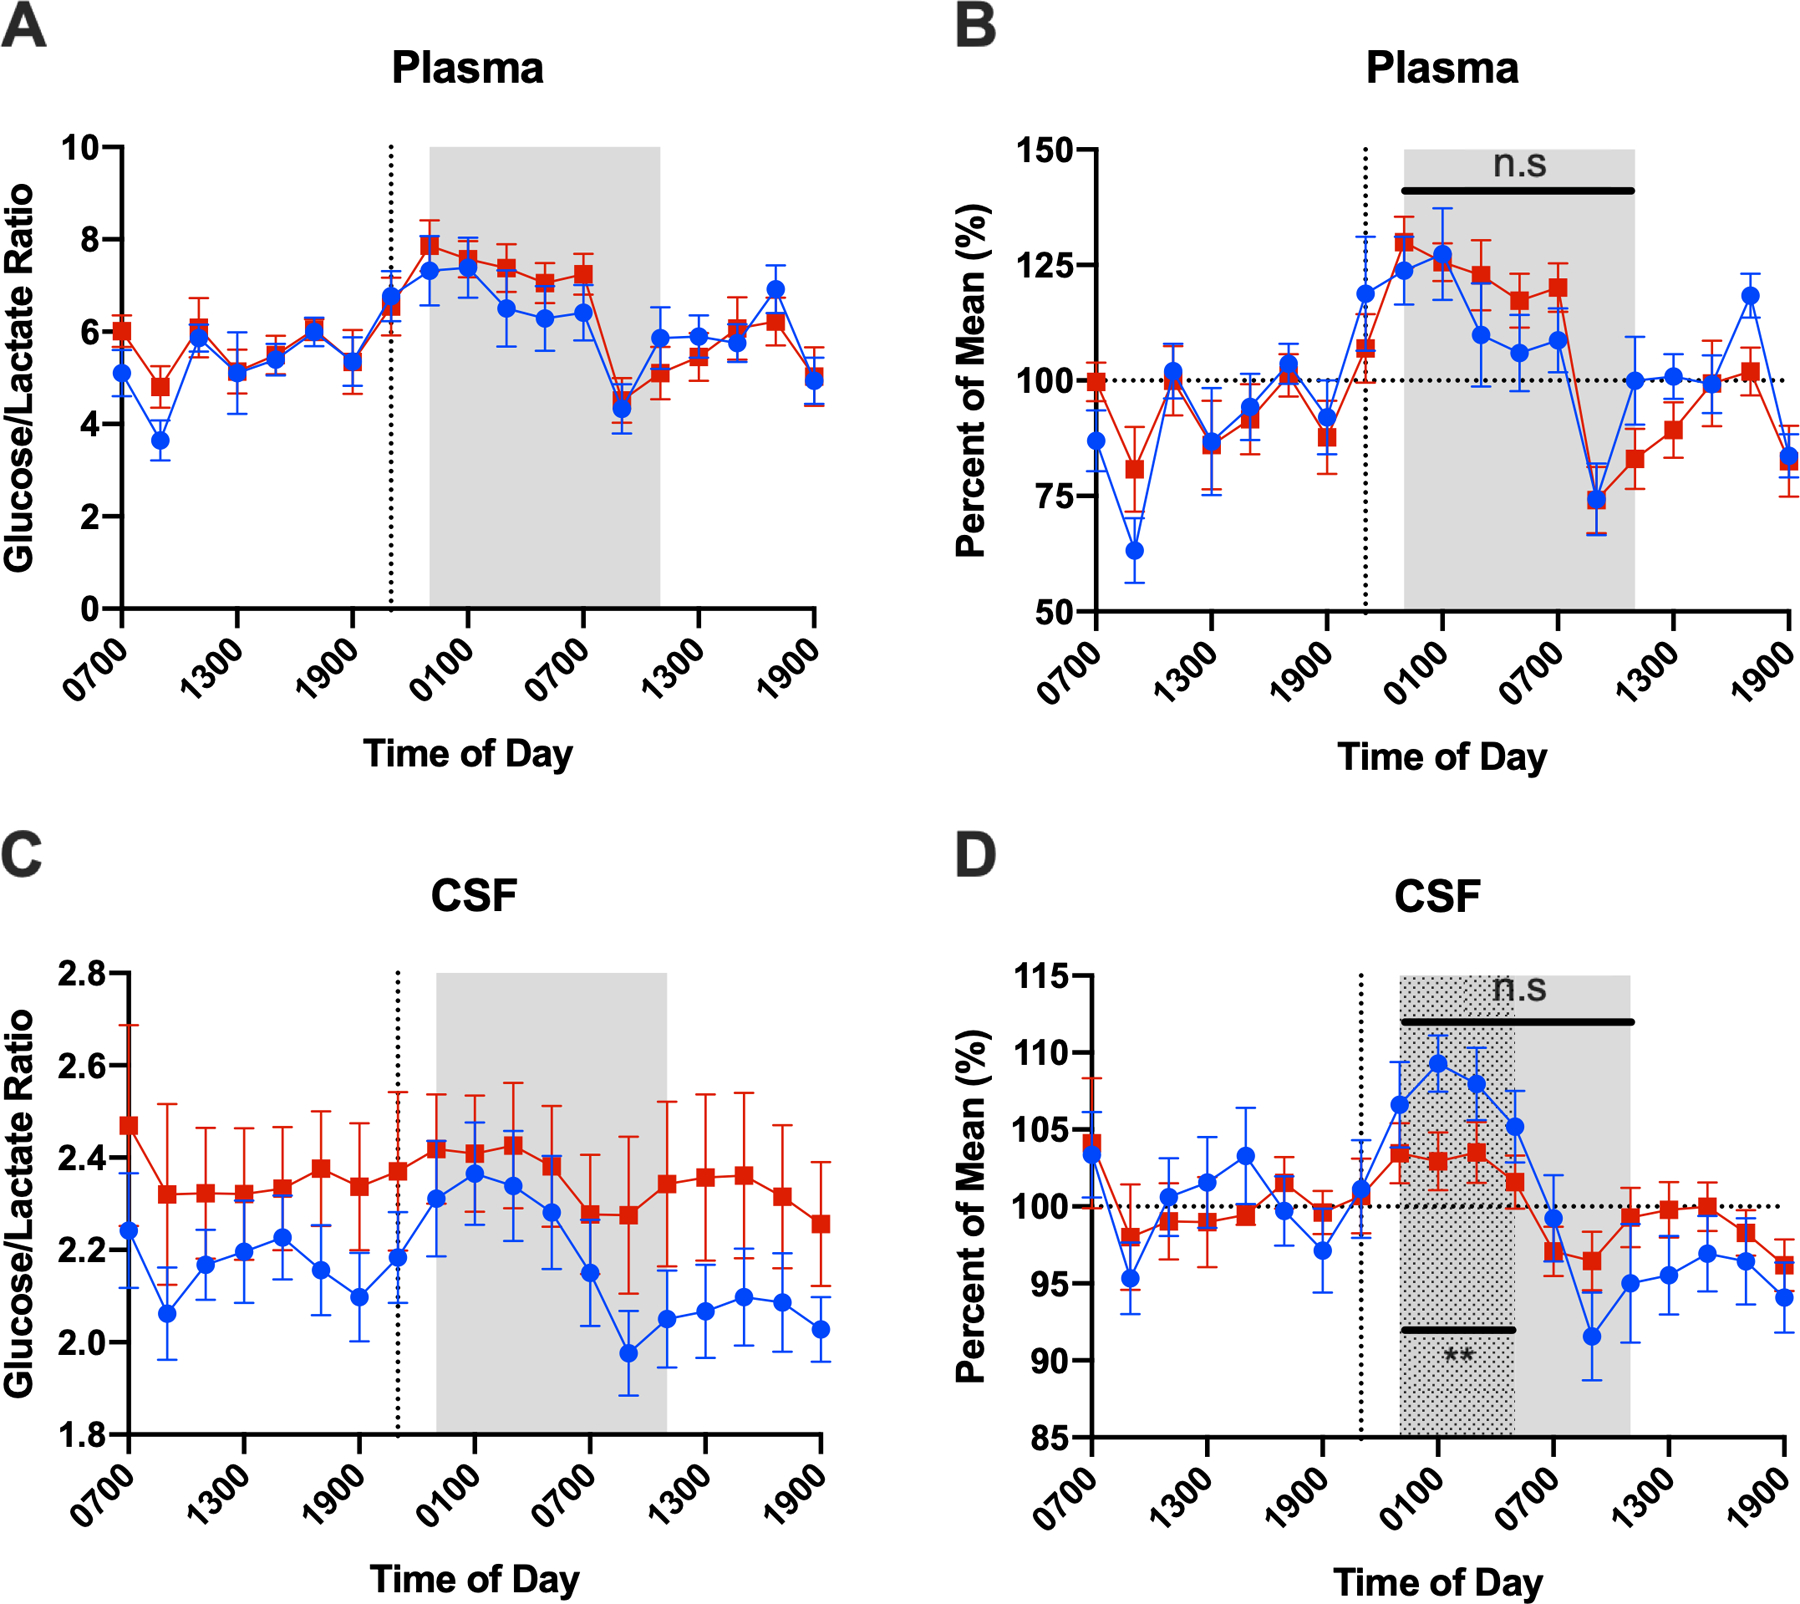
Figure 3:

Glucose/lactate ratio in plasma (A and B) and CSF (C and D) over the collection period. Glucose/lactate ratio is shown both without (A, C) and with normalization to percent of the mean (B, D). Mixed model analysis of time points after the intervention, 16–28 (23:00–11:00, gray shaded area) demonstrated no statistically significant difference between interventions in the plasma or CSF glucose/lactate ratio. Restricting the analysis to the time range 16–22 (23:00–05:00, dotted area) demonstrates that CSF glucose/lactate ratio increases more in the control group than sleep-deprived group while this difference is not significant in plasma glucose/lactate ratio. (Error bars show standard error. Blue circle = control, red square = sleep-deprived; CSF: cerebrospinal fluid. **p<0.01
