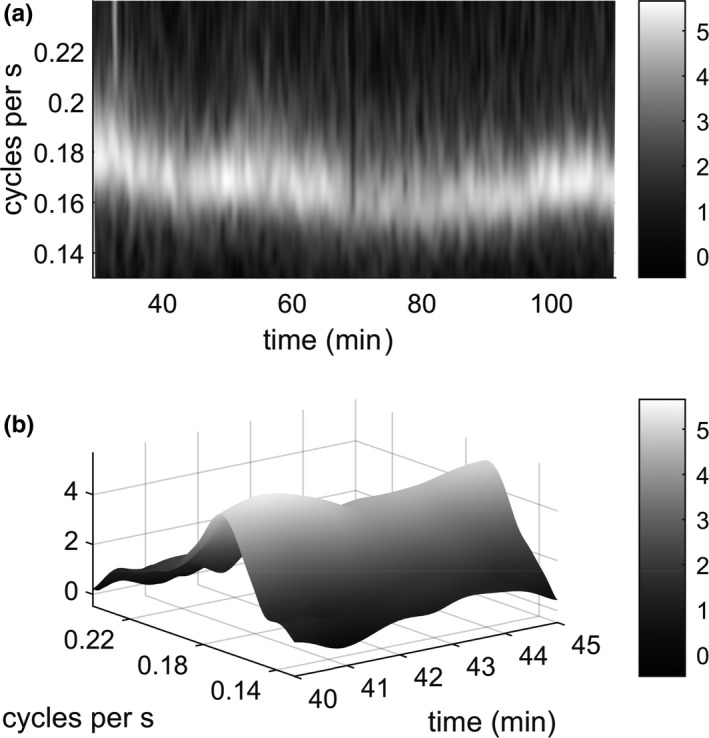
FIGURE 1.

Changing frequency of fluctuations in sound volume in the forest. (a) Log of average of transform energies (squared modulus of the transforms), where each transform was first scaled to have total time‐averaged energy 1 within a frequency range of 1/8 to 1/3 cycles per second. Time 0 is a primary reference event used to temporally match recordings (see Methods: Data). Time range shown here is the interval within which all sensors were active and undisturbed, beginning 3:54 p.m. local time. (b) A five‐minute segment of the above plot, presented in 3d to make the local maximum (at around 0.17 cycles per second) clearly visible. The cycling frequency associated with this feature is presented in Figure 3a as it varies over the whole period of measurement
