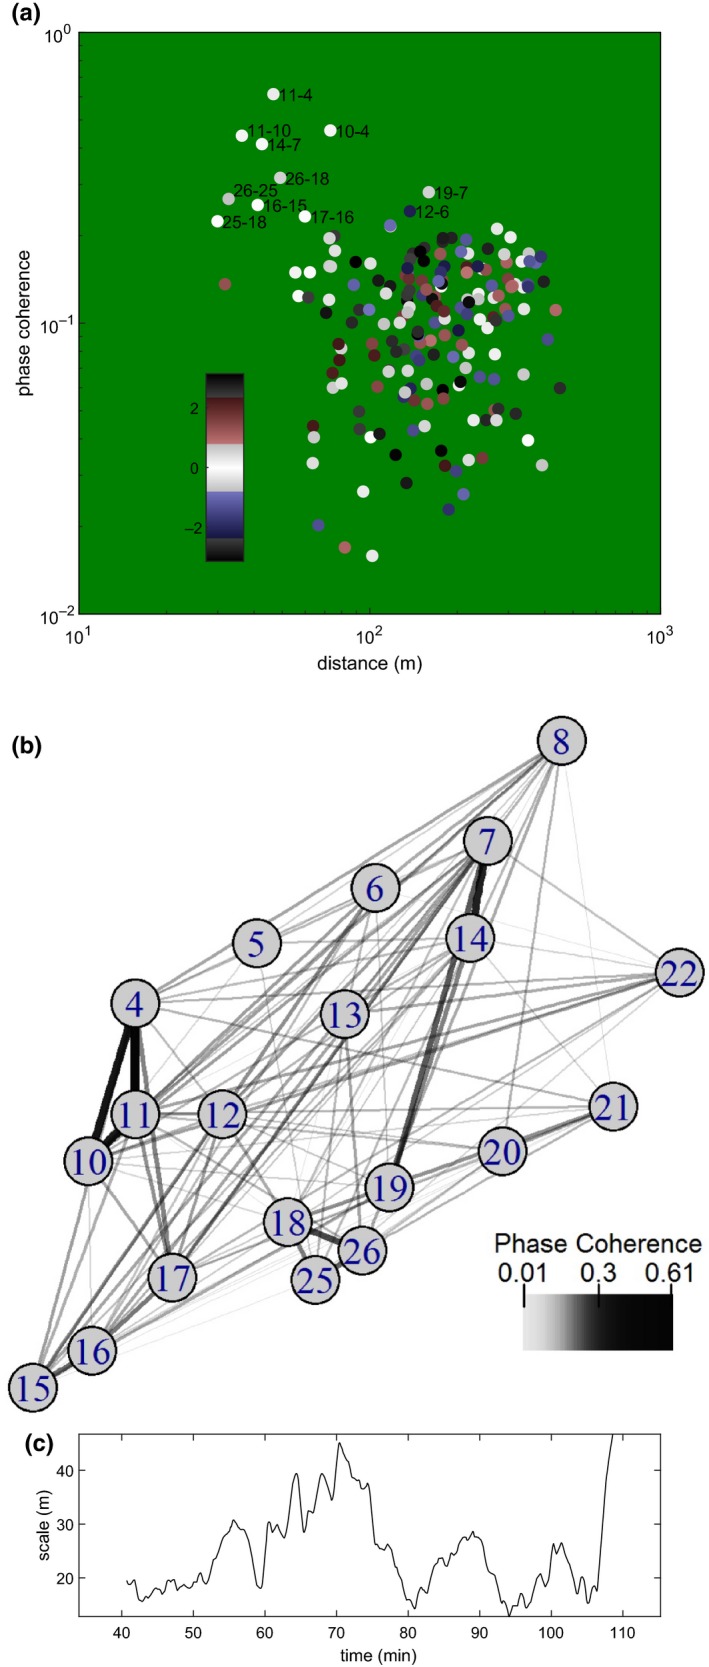
FIGURE 2.

Spatial synchrony falls with increasing distance. (a) Circles show phase coherence of pairs of transforms drawn from different locations, plotted against physical distance in space. Color indicates average relative phase, in radians. Note that high‐phase coherence pairs are in phase (white). The top ten highest‐phase coherence pairs are labeled with location numbers. (b) Strength of phase coherence between points on the map. (c) Characteristic distance scale of phase agreement in the forest as it varies in time (see Methods: Statistics)
