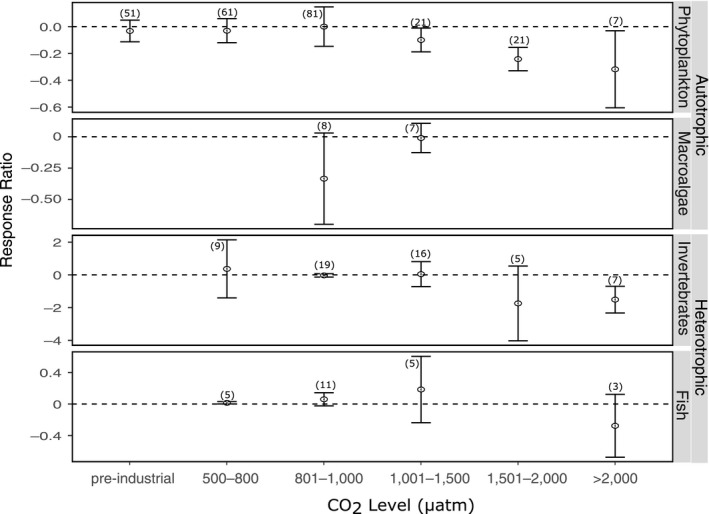
FIGURE 3.

The effect of ocean acidification on phytoplankton, macroalgae, invertebrates, and fish at different CO2 levels. Mean response ratios and 95% confidence intervals are shown, with the number of data points in each category given in brackets. A mean response ratio of zero (hashed line) indicates no effect
