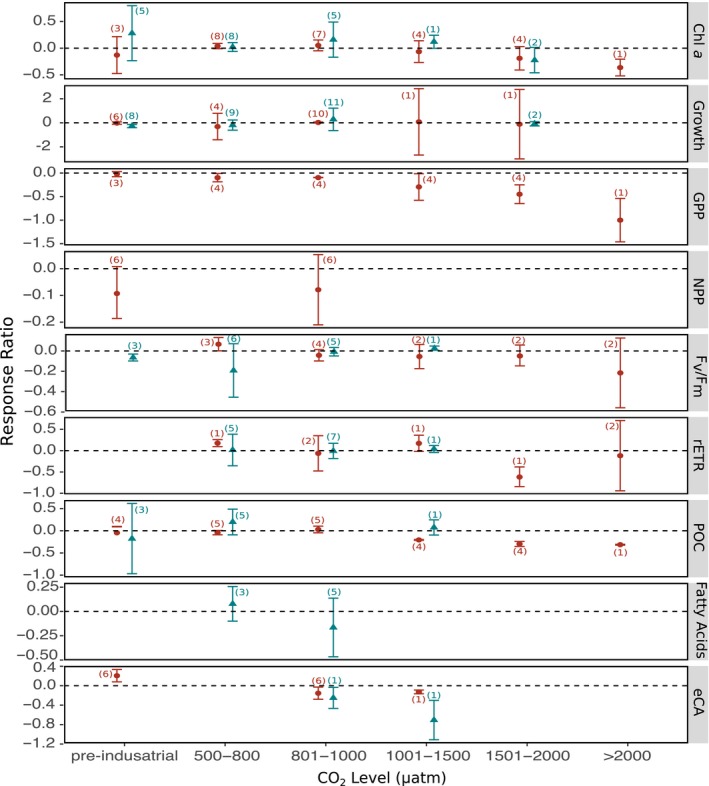
FIGURE 6.

The effect of ocean acidification on the biological responses of phytoplankton to increased CO2 levels, separating studies on single species (shown in blue triangles) from community‐level studies (shown in red circles). Mean response ratios and 95% confidence intervals are shown, with the number of data points in each category in brackets. A mean response ratio of zero (hashed line) indicates no effect. Refer to Table 1 for abbreviation definitions
