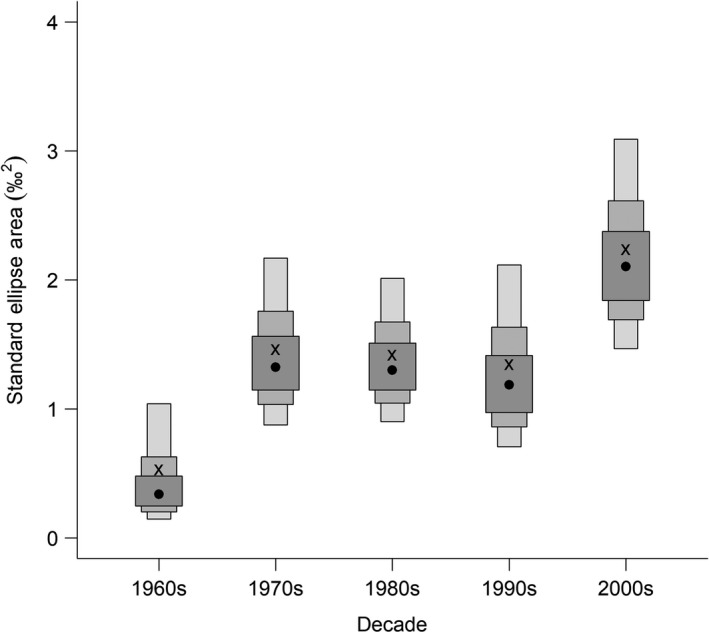
Figure 5.

Density plot produced by SIBER of the Bayesian estimate of the standard ellipse area (SEAb; ‰2) for Beaufort Sea ringed seal claw annuli δ13C and δ15N stable isotope values. The mode for each decade is represented by the black circle, and credible intervals of 50%, 75%, and 95% are represented by the shaded boxes
