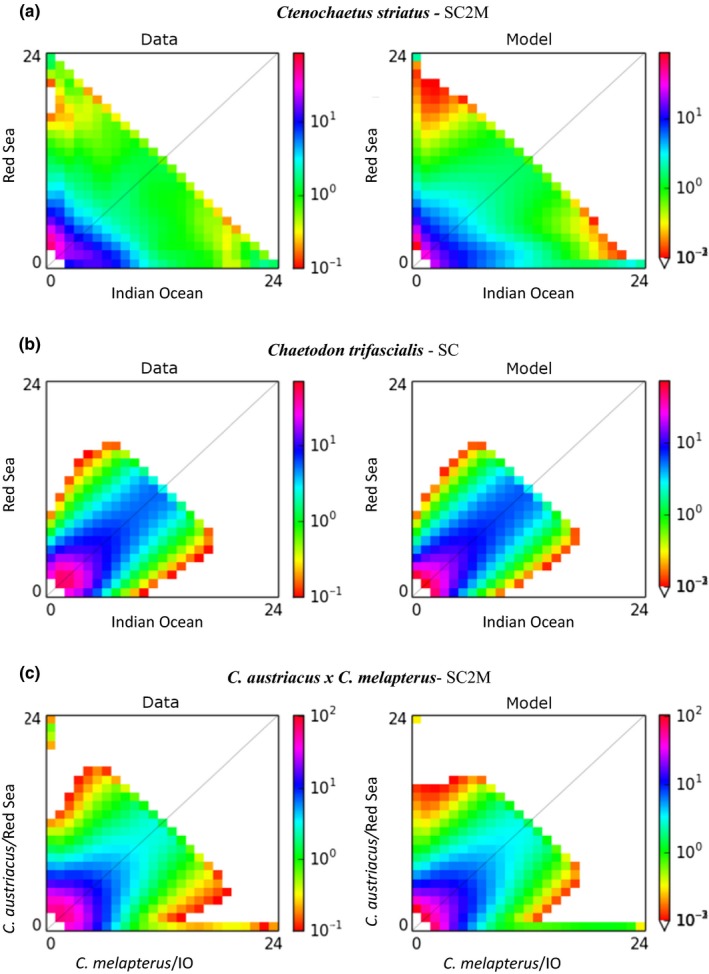
Figure 7.

Results of the diffusion approximation models for the (a) Ctenochaetus striatus, (b) Chaetodon trifascialis, and (c) Chaetodon austriacus and Chaetodon melapterus data sets. For each data set, the observed “data” and the best fitting “model” are displayed. Shading indicates probability matrix as indicated by the embedded legend. Plots of all alternative models tested, for each data set, are provided as Figures S1–S3
