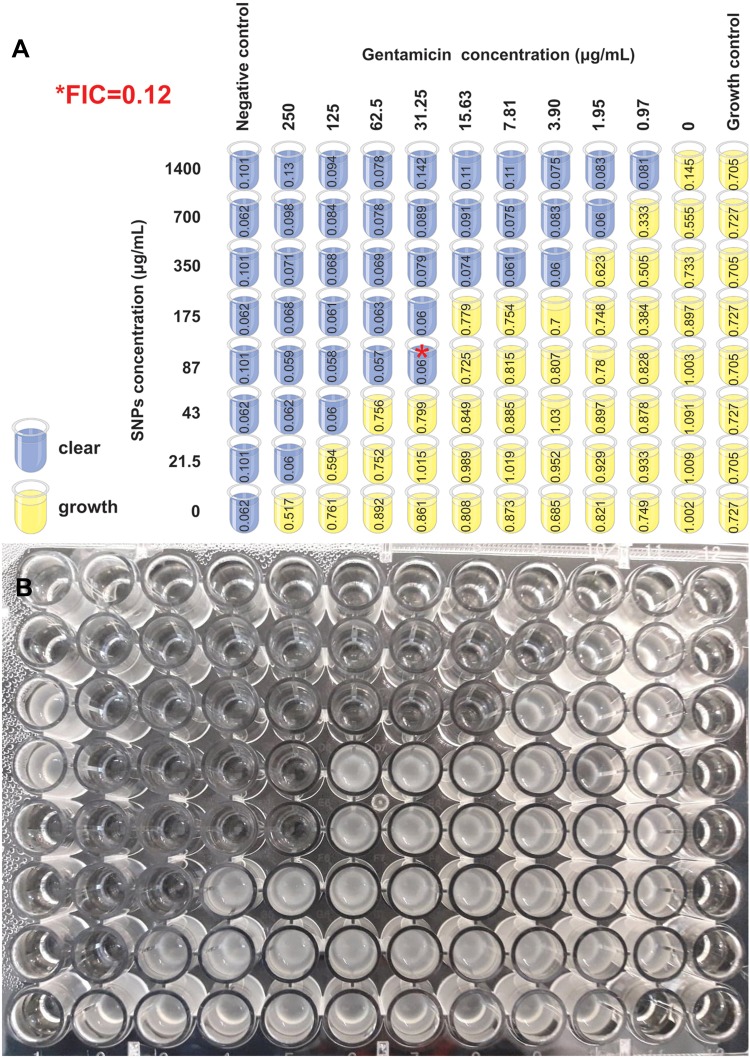
Figure 3.
Bacterial growth pattern in the presence of gentamicin and silver nanoparticles.
Notes: (A) Growth pattern of S.epidermidis K/8605/12 in the presence of gentamicin and SNPs. The dilutions of gentamicin (in range of 0.97 to 250 μg/mL) were made from left to the right side of the plate, dilutions of SNPs (in range of 21.5 to 1400 μg/mL) were made from upper to lower rows of the plate. The FIC index was established on the growth inhibition border. Minimal FIC index (0.12) identified the point where synergistic effect was the most prominent*. For each well, optical density (mean from duplicate measurements) were presented. (B)Photography of the growth of the presented strain of Staphylococcus epidermidis K/8605/12.
Abbreviations: FIC, fractional inhibitory concentration; SNPs, silver nanoparticles

