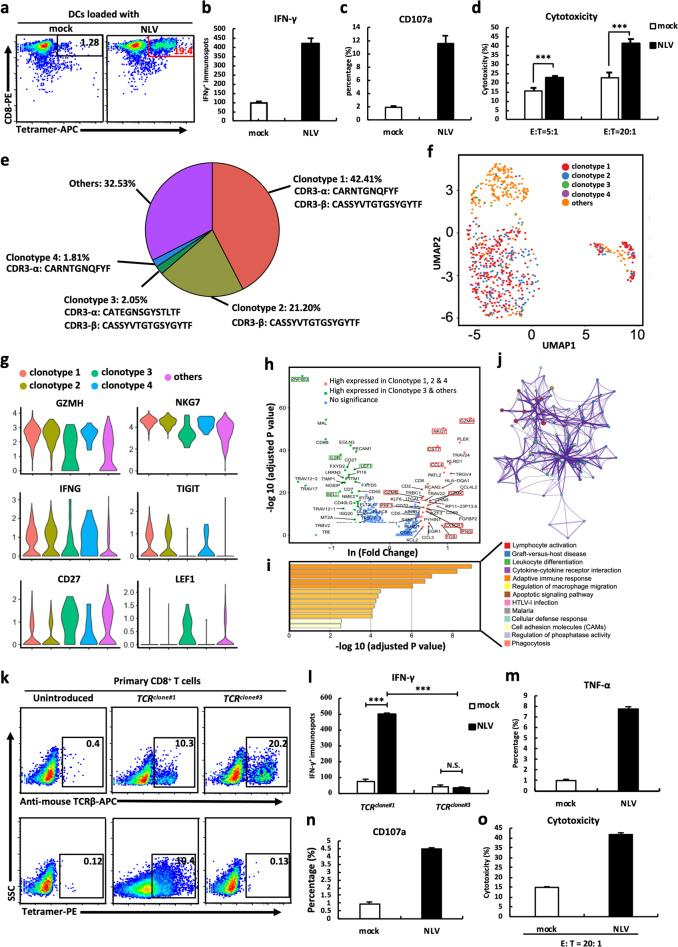
Fig. 1.
TCRs were identified by single-cell sequencing of engineered CD8+ T cells. a NLV-specific CD8+ T cells stained by NLV-MHC tetramer. IFN-γ secretion (b), CD107a degranulation (c), and cytotoxic activity (d) of NLV-stimulated T cells in response to T2 cells loaded with mock or NLV peptide. e The percentage and CDR3 amino acid sequences of distinct clonotypes. f Cells colored by clonotypes on the UMAP projection. g Violin plots of differentially expressed genes. h Differential gene expression analysis of functional gene sets in clusters 1 and 2. Each dot represents a gene. i GO and KEGG pathway enrichment analyses using genes upregulated in cluster 1. j Network of enriched terms in Fig. 2h colored by clonotype ID, in which nodes that share the same clonotype ID are typically close to each other. k Expression of introduced TCRclone#1 and TCRclone#3 in CD8+ T cells measured by NLV-MHC tetramer and anti-mouse TCRβ mAb. l IFN-γ ELISPOT results of TCRclone#1- and TCRclone#3-transduced CD8+ T cells in response to T2 cells loaded with mock or NLV peptide. TNF-α secretion (m), CD107a degranulation (n), and cytotoxic activity (o) of TCRclone#1-transduced CD8+ T cells in response to T2 cells loaded with mock or NLV peptide. Data are the mean ± SEM. Paired two-tailed Student’s t tests were conducted. P < 0.05 was considered significant. ***p < 0.001; N.S. not significant

