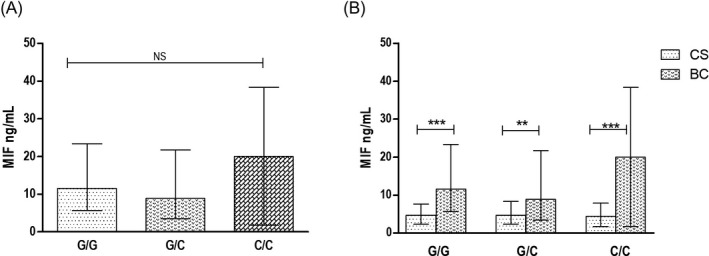
Figure 2.

The soluble levels of MIF in ‐173 G > C MIF genotypes. Soluble levels of MIF according to genotypes in women with BC (A). Levels of MIF in CS vs BC by genotypes (B). CS, control subjects; BC, breast cancer. Data provided in median (p25‐75). For the comparison, Mann‐Whitney U test was used (P*** .001)
