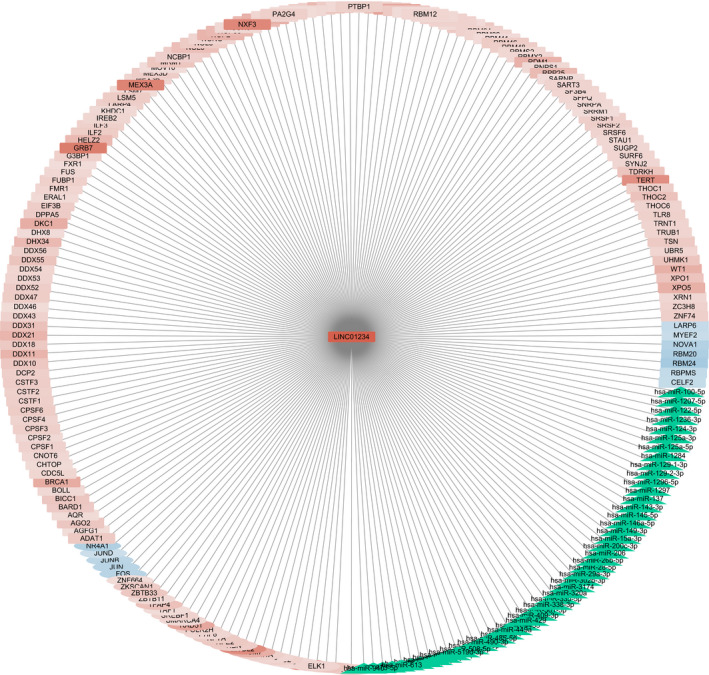
Figure 4.

Regulatory network of LINC01234 in GC. The central node is LINC01234. Rectangle nodes represent TF, circle nodes represent RBP, and green triangle nodes represent miRNA. Red color represents high expression in GC, while blue color represents low expression in GC. Color strength represents log2 value of fold change in GC tissues to adjacent normal tissues
