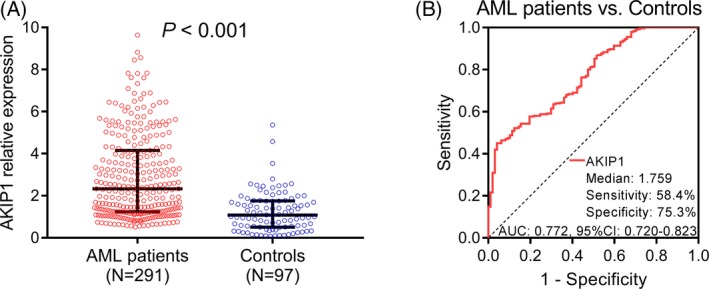
Figure 1.

Comparison of AKIP1 expression between AML patients and controls. A, AKIP1 expression in AML patients and controls. B, ROC curve for AKIP1 predicting AML risk. Comparison between groups was determined by Wilcoxon rank‐sum test. P < .05 was considered significant. AKIP1, A‐kinase interacting protein 1; AML, acute myeloid leukemia; AUC, area under the curve; ROC curve, receiver operating characteristic curve
