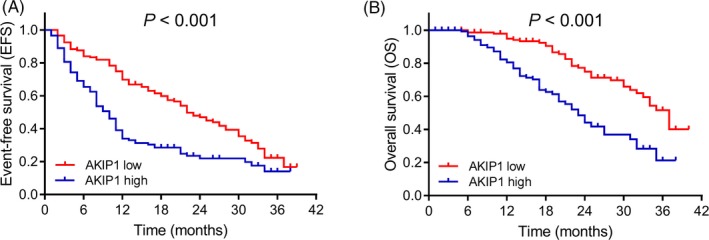
Figure 3.

EFS and OS in AML patients. A, EFS in AKIP1 high expression and AKIP1 low expression patients. B, OS in AKIP1 high expression and AKIP1 low expression patients. K‐M curves were used to exhibit EFS and OS. Comparison between groups was determined by log‐rank test. P value < .05 was considered significant. AKIP1, A‐kinase interacting protein 1; EFS, event‐free survival; K‐M curves, Kaplan‐Meier curves; OS, overall survival
