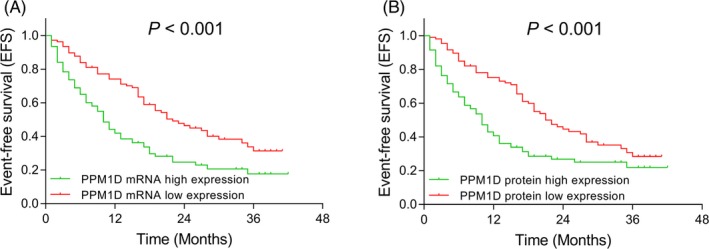
Figure 4.

Comparison of EFS between AML patients with PPM1D high and low expressions. The comparison of EFS between AML patients with PPM1D mRNA high expression and PPM1D mRNA low expression (A). The comparison of EFS between AML patients with PPM1D protein high expression and PPM1D protein low expression (B). Kaplan‐Meier curves were used to display EFS, and the difference of EFS between PPM1D high expression group and PPM1D low expression group was determined by log‐rank test. P value < .05 was considered significant. AML, acute myeloid leukemia; EFS, event‐free survival; mRNA, messenger RNA; PPM1D, protein phosphatase Mg2+/Mn2+ dependent 1D
