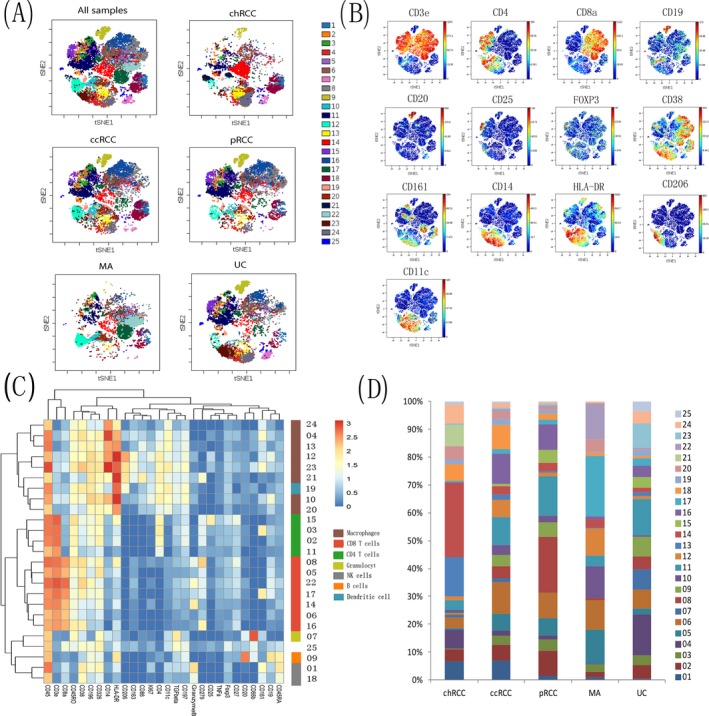
Figure 2.

Immune landscape of various types of renal tumors. A, The figure shows the t‐SNE descending dimension map of the samples of various types of renal tumors. About 12 000 CD45+ immune cells were grouped into 25 clusters, the samples were classified and analysed, and colors represent different clusters of immune cells. B, The figure shows that the expression level and distribution of main cluster markers on the t‐SNE dimensionality reduction map. Bar on the right represents the median expression intensity of each marker. C, The heat map shows the differential expression of immune markers in the 25 subsets. Certain clusters were identified as known cell types according to typically expressed markers. Cluster ids and relative intensity were shown as bars on the right. D, The stacked graph represents the relative content of each cluster in different renal tumors, and the Y‐axis is the percentage of each cluster in CD45+ cells
