Figure 2.

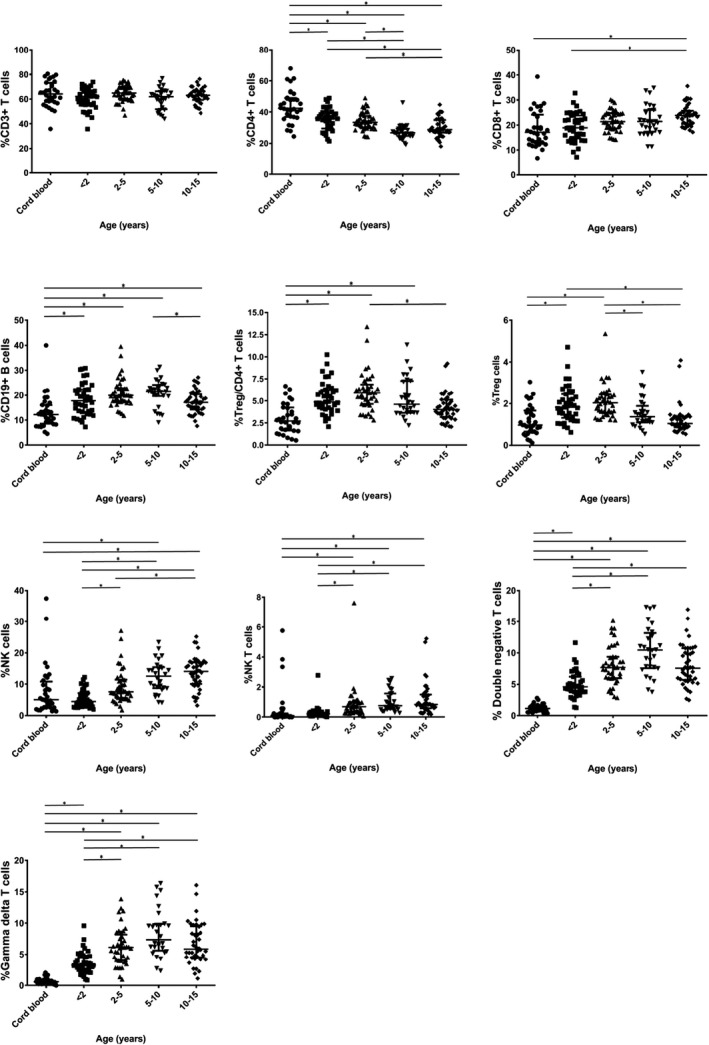
Comparison of percentages of lymphocyte subpopulations among the different age groups. Lines represent medians and interquartile ranges, *P < .05

Comparison of percentages of lymphocyte subpopulations among the different age groups. Lines represent medians and interquartile ranges, *P < .05