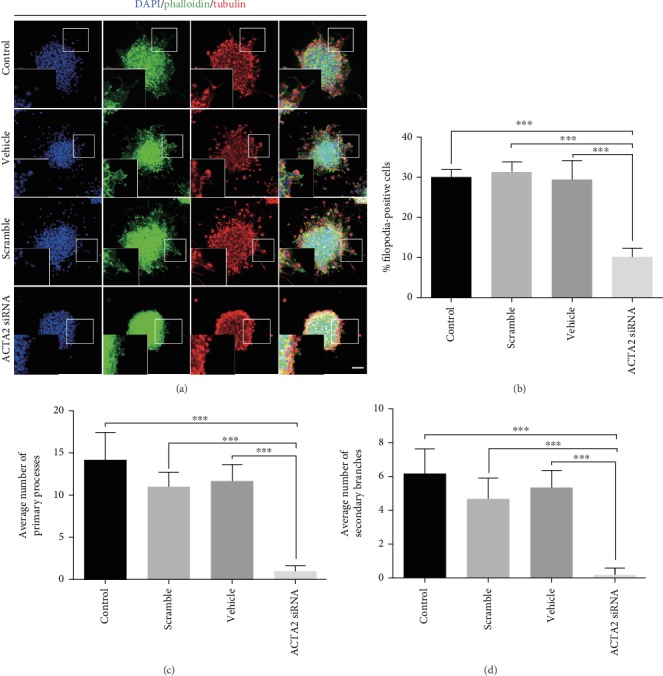
Figure 4.

ACTA2 downregulation inhibited filopodia formation. (a) Representative immunostaining of tubulin and phalloidin after neurosphere migration for 12 hours in various groups. Cell nuclei were counterstained with DAPI in blue. Scale bar: 100 μm. (b) Quantification of the percent of filopodia formation in each group (n = 6 for each group). ∗∗∗p < 0.001, one-way ANOVA followed by Tukey's post hoc test. (c) The average number of primary processes was summarized in the statistical graph (n = 6 for each group). ∗∗∗p < 0.001, one-way ANOVA followed by Tukey's post hoc test. (d) Quantification of the average number of secondary branches (n = 6 for each group). ∗∗∗p < 0.001, one-way ANOVA followed by Tukey's post hoc test.
