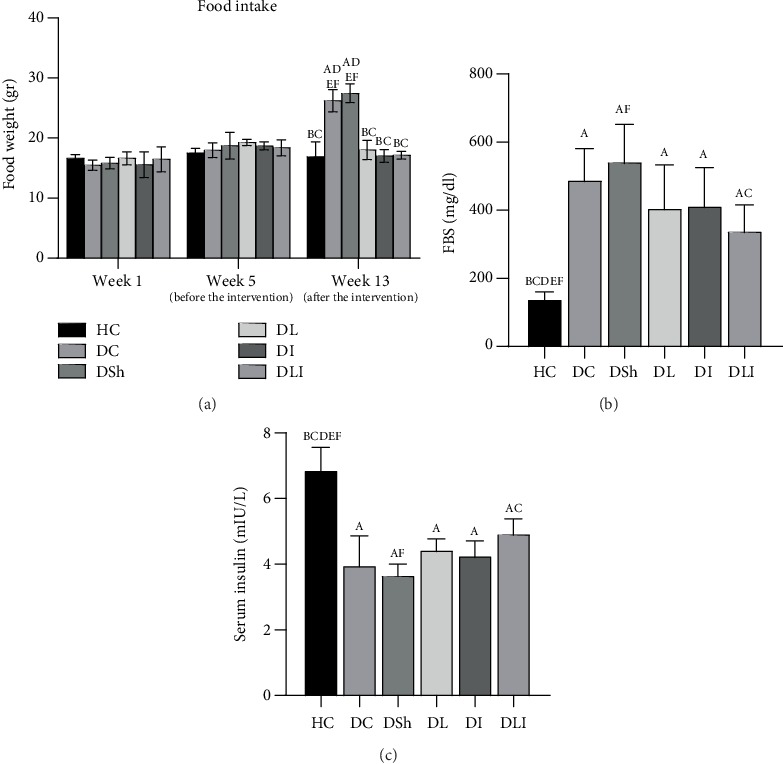
Figure 1.

Effects of L. plantarum and inulin supplementation on (a) food intake, (b) FBS, and (c) serum insulin of the control and diabetic rats (n = 35). HC: healthy control; DC: diabetic control; DSh: diabetic sham; DL: diabetics treated by L. plantarum; DI: diabetics treated by inulin; DLI: diabetics treated by L. plantarum and inulin. Data were expressed as mean ± SD and regarded significantly different at P < 0.05 with a post hoc Tukey test.
