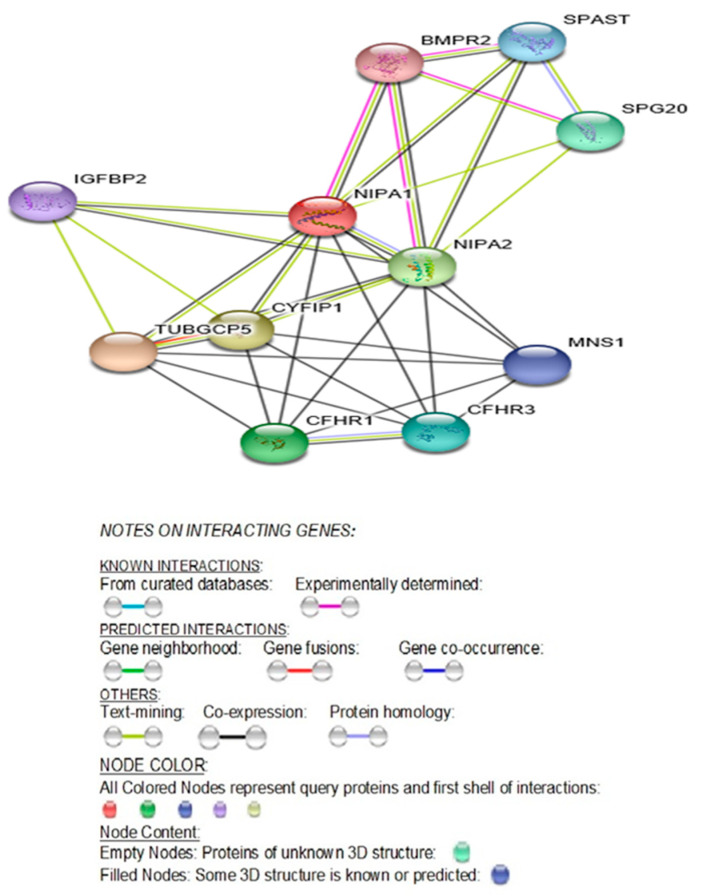
Figure 2.
STRING Protein-Protein Interaction network involving NIPA1, NIPA2, CYFIP1, and TUBGCP5 genes with functional interactions showing 11 nodes (Table 1) and 34 edges and predicted functional interactions, such as, biological process (GO) and molecular function (GO) (Table 2), as designated in STRING: 9606.ENSP00000337452 (STRING Consortium 2019). Network nodes represent proteins (Table 1) with splice isoforms or post-translational modifications collapsed into each node for all proteins produced by a single protein-coding gene. Edges represent protein-protein associations that are considered specific and meaningful, i.e., proteins jointly contribute to a shared function, such as, Biological Process (GO) and Molecular Function (GO) (Table 2).

