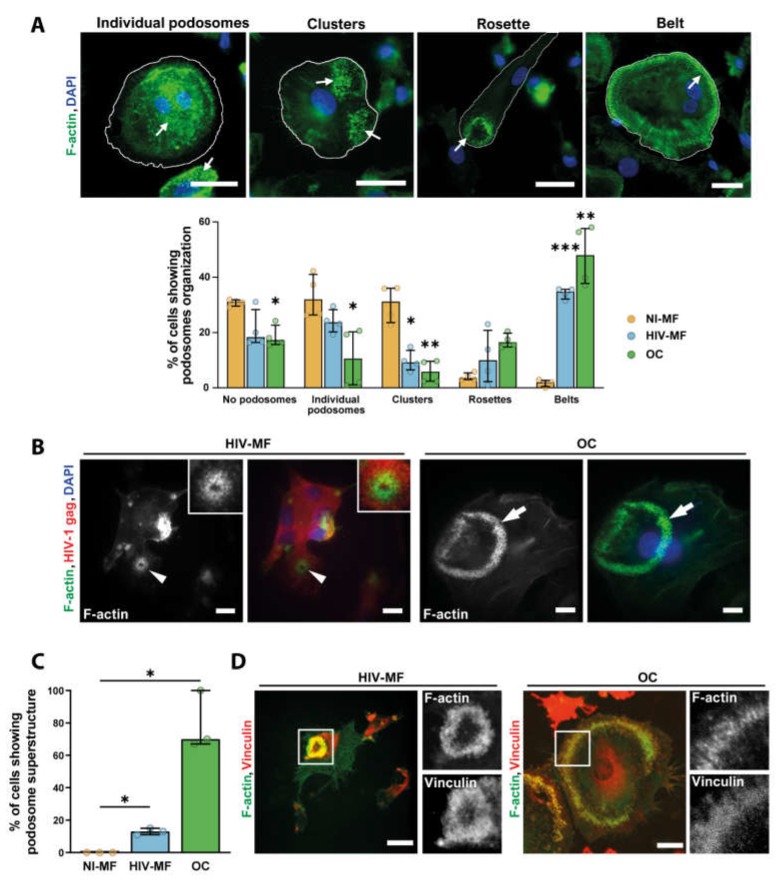
Figure 2.
HIV-1 infection of MF promotes podosome organization into super-structures. (A) Top: Representative IF images of different podosome organizations in MF or OC seeded on glass coverslips, after staining for F-actin (green) and nuclei (DAPI, blue). White arrows show podosome structures. Scale bar, 20 µm. Bottom: Quantification of the different podosome organizations in non-infected MF (NI-MF), HIV-1-infected MF (HIV-MF, ADA strain), and OC represented in percentage of total cells. Histograms represent median and error bars are in interquartile range, n = 4 donors, 300 cells analyzed per donor. (B) Monocytes were seeded on bone slices and differentiated into MF or OC. Then, at day 7, MF were infected with HIV-1 (NLAD8 strain) and all cells were fixed at day 14. Left: representative IF images of podosome super structures in HIV-MF (arrowheads) and OC (arrows) stained for HIV-1 gag (red), F-actin (green), and nuclei (DAPI, blue). Scale bar, 5 µm. Inserts show two-fold magnification of the podosome structure in HIV-MF. (C) Quantification of the percentage of MGC showing podosome organization on bones, evaluated by IF. Histograms represent median and error bars are in interquartile range, n = 3 donors, 100 cells analyzed per condition. (D) Representative image of podosome super-structures formed by HIV-MF (NLAD8 strain, left) or OC (right) seeded on bone slices, after staining for F-actin (green) and vinculin (red). Scale bar, 10 µm. Inserts show two-fold magnification of white square. * p ≤ 0.05; ** p ≤ 0.01; *** p ≤ 0.001.

