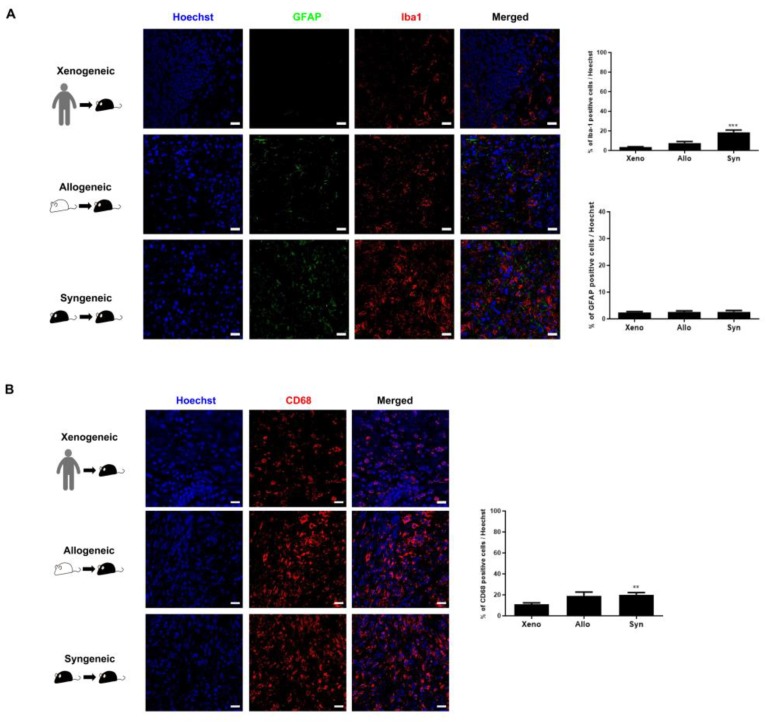
Figure 4.
Highest Iba-1 and CD68 expression levels were identified in the syngeneic group. (A) The expression of GFAP-positive astrocytes was extremely low compared to that of Iba-1-positive microglia for all three groups. The highest expression of Iba-1-positive microglia was discernible in the syngeneic (syn) group and the lowest was identified in the xenogeneic (xeno) group. (B) Lowest number of CD68-positive macrophages occurred in the xenogeneic (xeno) group, whereas the highest number of CD68-positive macrophages occurred in the syngeneic (syn) group. Statistical significance was defined as ** p < 0.01, *** p < 0.001 vs. xenogeneic (xeno); mean ± S.E.M. Scale bars = 20 µm.

