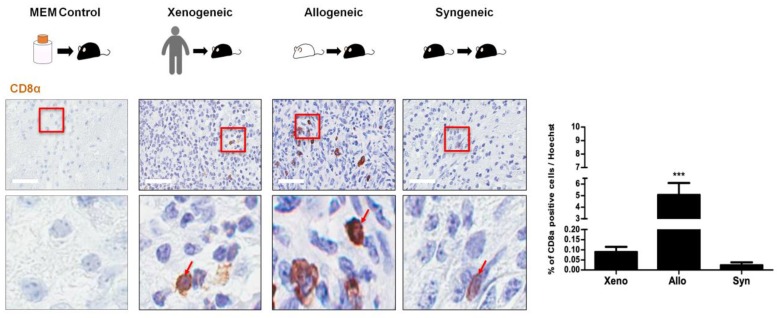
Figure 6.
Relatively low expressions of CD8 T cells were identified at the injection sites in all three groups. Very few CD8 T cells (indicated as solid red arrows) were identified at the injection site, including the MEM-injected group. Compared to the xenogeneic (xeno) group, the highest number of CD8 T cells was observed in the allogeneic (allo) while the lowest number was observed in the syngeneic (syn) group. Red solid frames indicated magnified area of CD8 T cells. Statistical significance was defined as *** p < 0.001 vs. xenogeneic (xeno); mean ± S.E.M. Scale bars = 50 µm.

