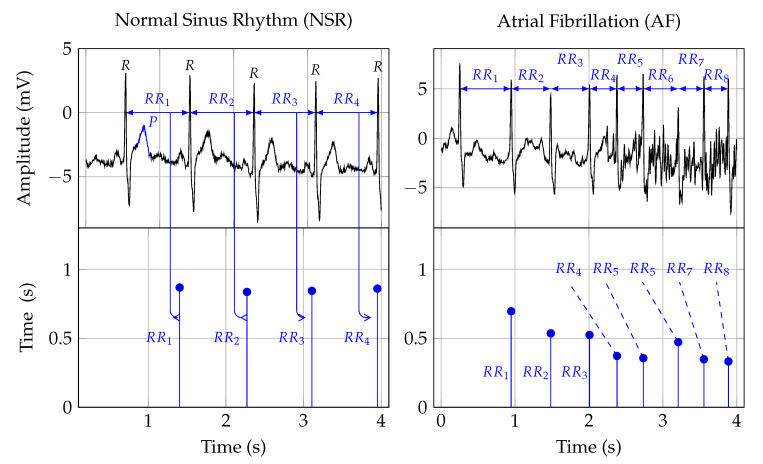
Figure 1.
The first row depicts two ECG signals and the second row the corresponding RR interval traces. The two plots in the first column show NSR, and the plots in the second row show AF symptoms. The Rpeak, in the ECG plots, indicates ventricular depolarization, i.e., the time of the heart beat. The time between two heart beats, say a and b, is indicated as the RRinterval. That time duration forms the amplitude, and the time location of the second beat b is the time location of an RR interval sample. The Pwave, labeled in the NSR ECG plot, indicates atrial depolarization.

