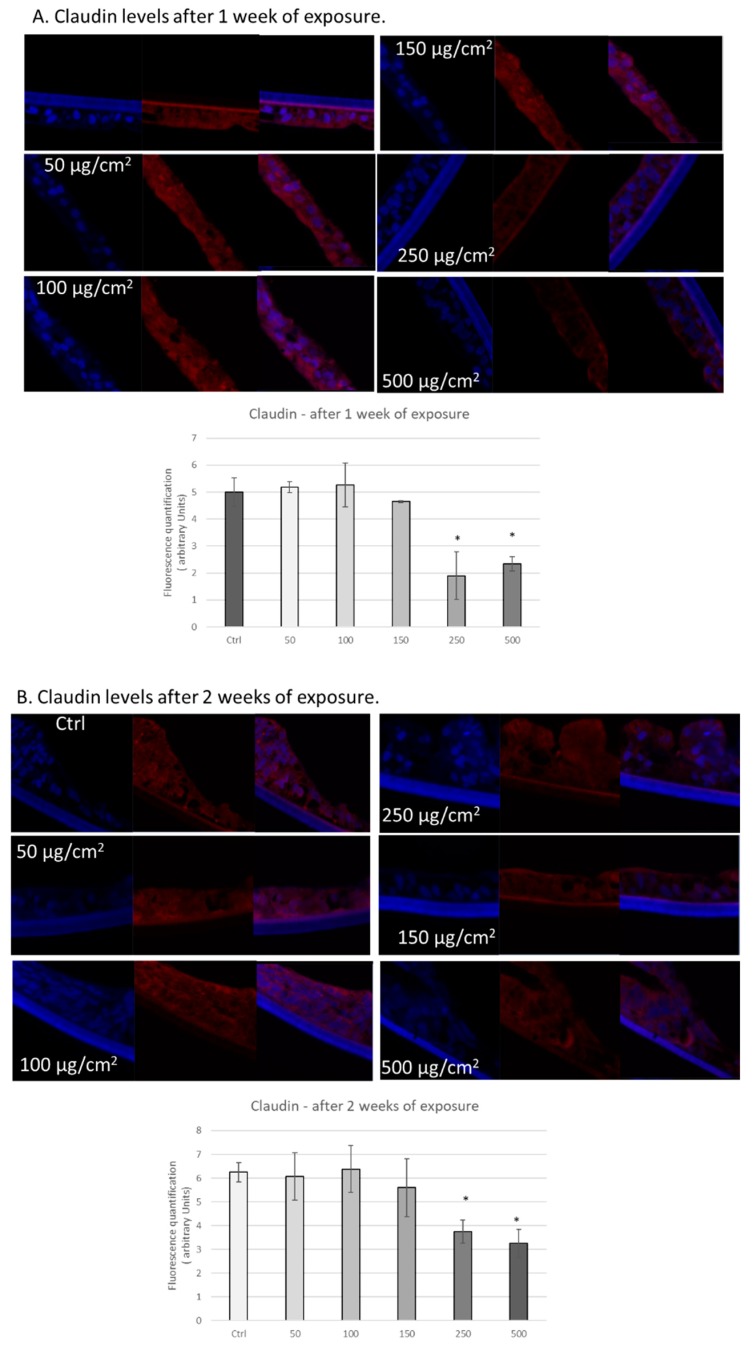
Figure 4.
Exposure to particulate matter decreased levels of claudin after one week and two weeks of exposure. Representative immunofluorescence images of levels of claudin (red color) in EpiIntestinal tissues after one week (A) or two weeks (B) of exposure with the following doses of PM: 50, 100, 150, 250, and 500 µg/cm2. Red staining represents claudin. Blue staining represents DAPI. Quantification of at least three independent images taken of stained tissues from two independent experiments is represented in graphs A and B. Data are expressed as arbitrary units (averages ± SEM of two experiments, * p < 0.05).

