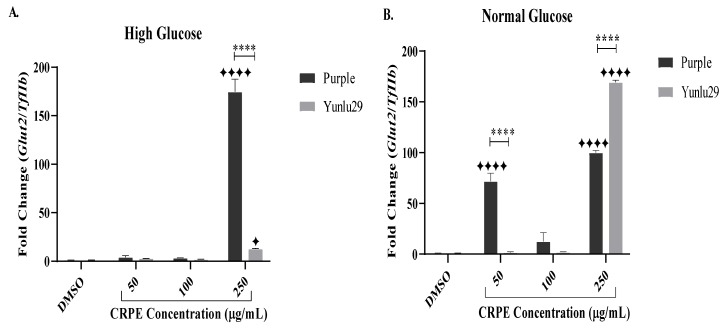
Figure 2.
Expression of Glut2 in INS-1E cells. A) high glucose (25 mM). B) normal glucose (11.1 mM). n = 3. Stars indicate significant differences between extracts and DMSO, where ✦ p < 0.05, ✦✦✦✦p < 0.0001. Asterisks indicate significant differences between the CRPE extracts, where, ****p < 0.0001; two-way ANOVA with Turkey’s multiple comparison post hoc test. Data is presented as mean ± SEM. Glut2–glucose transporter 1; TfIIβ–transcription factor II β; INS-1E—Insulinoma cells; DMSO—dimethyl sulfoxide; CRPE—coloured rice phenolic extract.

