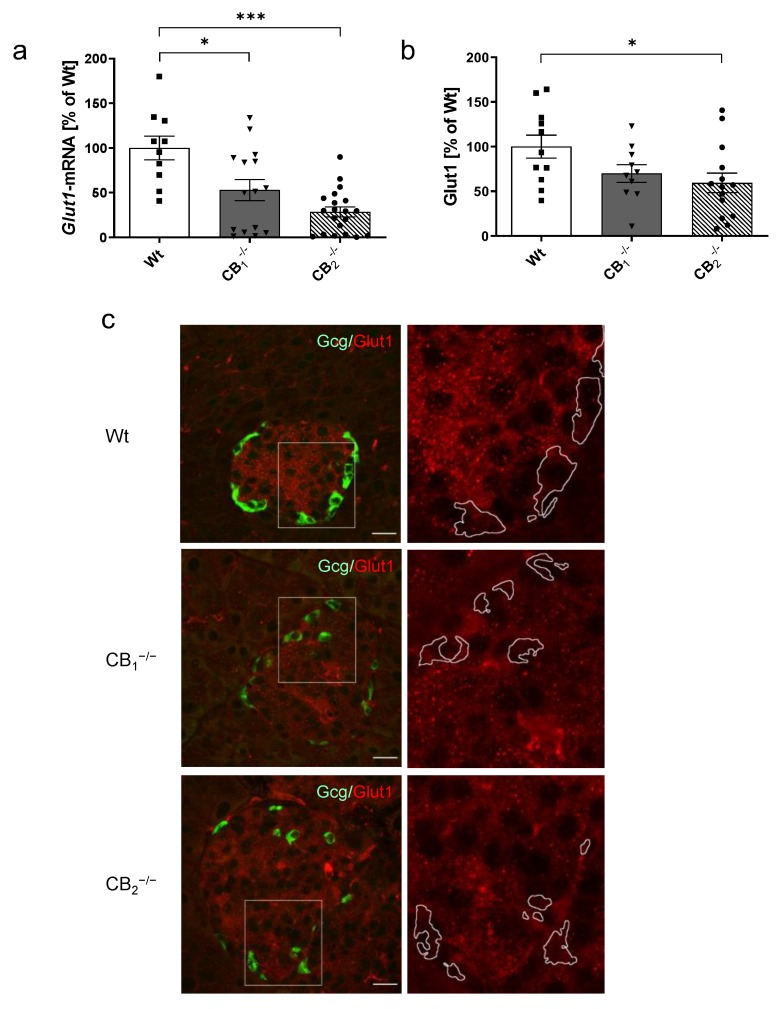
Figure 5.
Analysis of glucose transporter 1 mRNA levels (Glut1) and protein (Glut1) in pancreatic tissue of male and female wild-type (Wt) mice and cannabinoid receptor knockout mouse lines (CB1−/−, CB2−/−). (a) Relative mRNA expression level of Glut1 was decreased in both knockout mouse lines (n = 10–20). (b) In addition, protein content of Glut1 was also decreased in CB1−/− and CB2−/− mice (n = 10–14). (c) Immunohistochemical staining of Glut1 (red) and colabelling of glucagon (Gcg, green) confirmed the localisation of Glut1 in both alpha- and beta-cells. A magnification of each islet (2.5 fold, box) is shown on the right column, and revealed the reduction of Glut1 in knockout mouse lines. In all cases, confocal optical sections were merged and are representative for pancreatic islets analysed in the whole pancreatic tissue from three mice per group. Values are presented as mean (±S.E.M.) and Wt values were defined as 100%. * p < 0.05; *** p < 0.001; unpaired t-test. Scale bar 20 µm.

