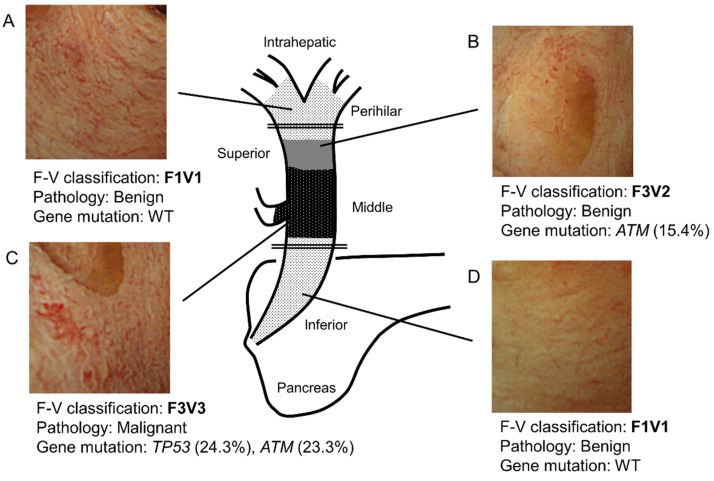
Figure 4.
Schema of a representative bile duct carcinoma case. (A) In the perihilar bile duct, POCS showed the presence of a flat bile duct epithelium with a network of thin vessels (F1V1). In this region’s biopsied specimens, neither a tumor nor a genetic mutation was identified. (B) In the superior bile duct, POCS revealed a papillary bile duct epithelium with irregular, non-dilated vessels (F3V2). In this region’s biopsied specimens, no tumor was observed. However, a genetic mutation in ATM was found (VAF; 15.4%). (C) In the main lesion of the middle bile duct, POCS demonstrated the presence of a papillary bile duct epithelium with an irregular, dilated, and tortuous vessel (F3V3). The biopsied specimens showed adenocarcinoma. Genetic mutations in TP53 (VAF, 24.3%) and ATM (VAF, 23.3%) were identified. (D) In the inferior bile duct, POCS revealed a flat bile duct epithelium, with a network of thin vessels (F1V1). In this region’s biopsied specimens, neither a tumor nor genetic mutation was observed. VAF, variant allele frequency; WT, wild type. The double line shows the resection line.

