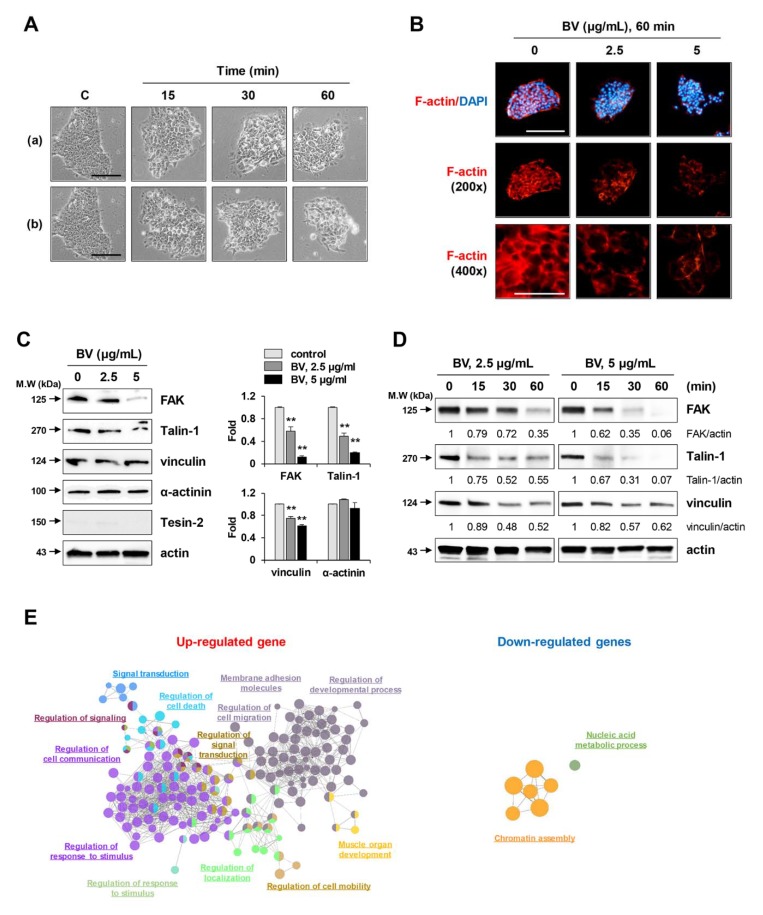
Figure 2.
Effects of BV on the morphological change and F-actin intensity in iPSCs. (A) iPSCs were treated with 2.5 μg/mL (a) and 5 μg/mL (b) of BV and the morphological changes at 15, 30, and 60 min post-treatment were observed under an inverted microscope. Scale bar = 50 μm. (B) iPSCs seeded on the confocal dishes were treated with 2.5 and 5 μg/mL BV for 60 min and stained for F-actin with TRITC-conjugated phalloidin. Nuclei were counterstained with DAPI and then observed under a fluorescence microscope at low (200×) and high (400×) magnification. Scale bar = 50 μm. (C) iPSCs were treated with 2.5 and 5 μg/mL BV for 1 h and the levels of focal adhesion proteins were determined by Western blotting. Relative band intensities compared with BV-untreated iPSCs were calculated using Image J software after normalization to actin expression and expressed as means ± SD from two independent samples. **p < 0.01 vs. BV-untreated control (D) iPSCs were treated with 2.5 and 5 μg/mL BV. Protein samples at 15, 30, and 60 min post-treatment were harvested and then subjected to Western blotting. Data are representative of two independent experiments. (E) The enriched GO terms associated with DEGs were clustered (false discovery rate; FDR < 0.01) in network and represented with the same color. Representative functional terms for each cluster are shown. The size of each node indicates the enrichment significance of the GO term.

