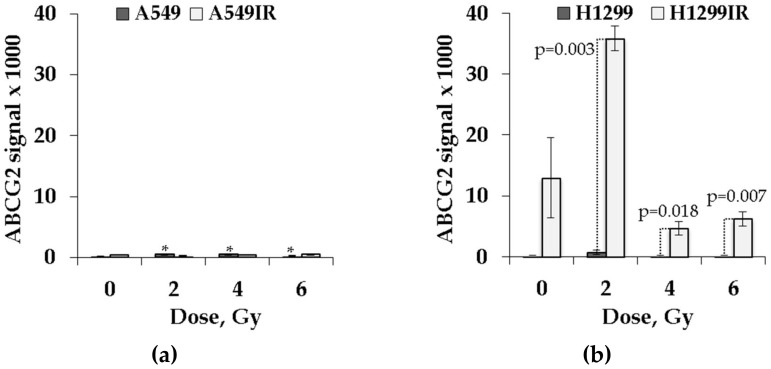
Figure 9.
ABCG2 expression profile in parental and irradiation-surviving NSCLC cell lines. (a) A549IR cells did not show any difference in ABCG2 expression 24 h after exposure to IR compared to parental A549 cells; (b) H1299IR cells showed statistically significantly higher level of ABCG2 expression after IR exposure compared to parental H1299 cells. ABCG2 signal normalized to the number of cells. * denotes significant differences between correspondent control groups at p < 0.05. Data are means ± SEM of more than three independent experiments.

