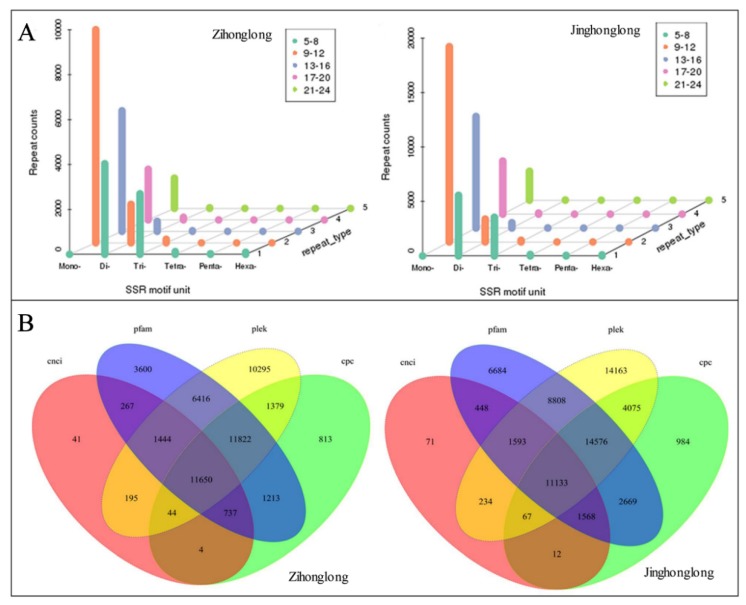
Figure 3.
SSRs and lncRNAs of pitaya pulp. (A), The distribution characteristics of SSRs motifs. (B), Venn diagram of the number of lncRNAs predicted by Coding-Non-Coding Index (CNCI), pfam, Plek, and Coding Potential Calculator (CPC). Note, the number in Figure 3B represents the amount of lncRNAs.

