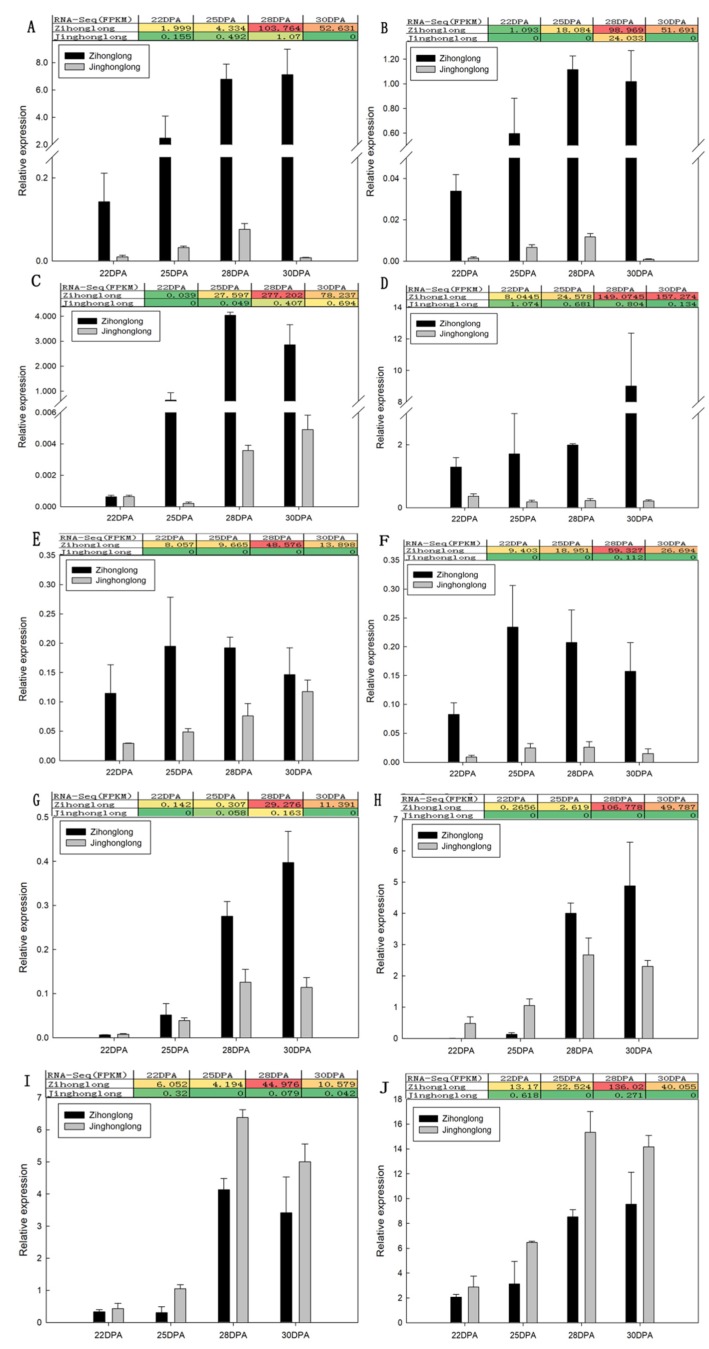
Figure 5.
qRT-PCR of candidate gene involved in betalain biosynthesis. (A), HpDOD1; (B), HpDODA2; (C), HpCYP76AD4; (D), HpGSTs; (E), HpBPE; (F), HpNAC; (G), HpCYP704C1; (H), HpFAR; (I), HpSTK; (J), HpVPP1. Note, the colors in the graph indicate the magnitude of gene expression in the sample. Red indicates that the gene is highly expressed in the sample, yellow indicates that the gene expression is middle, and the blue indicates that the gene expression is low.

