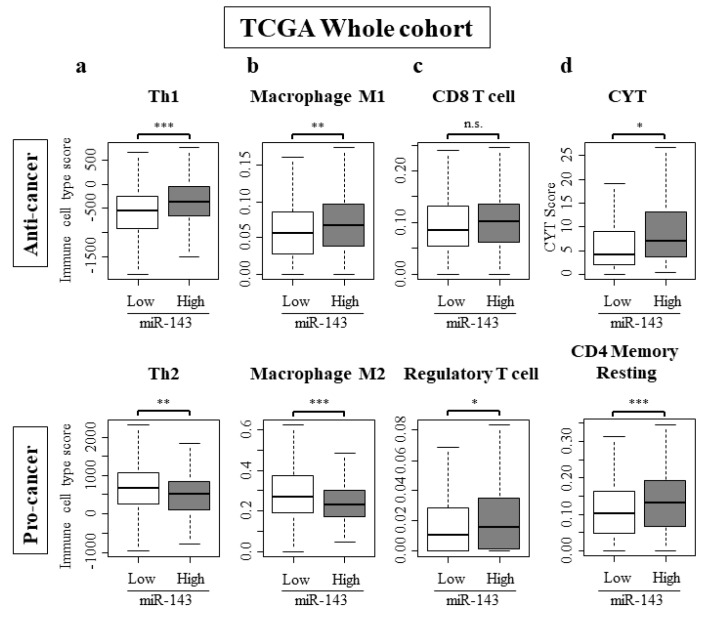
Figure 4.
Immune cell composition within a tumor and CYT score. (a) Th1 was higher and pro-cancer immune cells Th2 were lower in miR-143 high expression group; (b) Anti-cancer immune cells, M1 was higher and pro-cancer immune cells M2 were lower in miR-143 high expression group. (c) Regulatory T cell was higher in miR-143 high expression group; (d) CYT was higher in miR-143 high expression group. * p < 0.05; ** p < 0.01; *** p < 0.001; n.s., not statistically significant. Th1, Helper T cell type 1; Th2, Helper T cell type 2; CYT, Cytolytic Activity.

