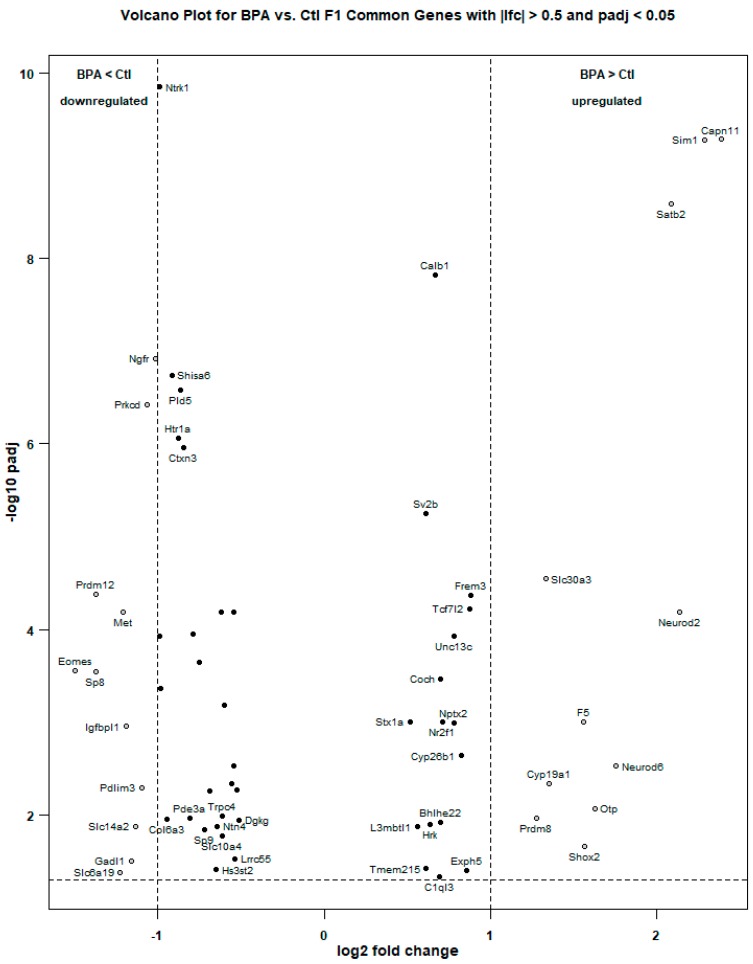
Figure 1.
Volcano plot of the 63 differentially expressed genes in the F1 generation common to the STAR/featureCounts/DESeq2 and TopHat/Cuffdiff RNA-Seq analyses. Only the section of the log-scale y axis for which the adjusted p value is less than 0.05 (−log10(0.05) = 1.3) is shown. The higher up and further to the edges that a gene is situated, the greater the effect size (higher log fold change) and the higher the statistical significance (lower adjusted p value) of the differential expression. Four genes were determined to be upregulated by a fold change of more than 2 and 11 genes were determined to be upregulated by a fold change of more than 1 (dots on the right) under direct exposure in utero to bisphenol A (BPA). Eleven genes (dots on the left) were determined to be downregulated by a fold change of more than 1 under direct exposure in utero to BPA.

