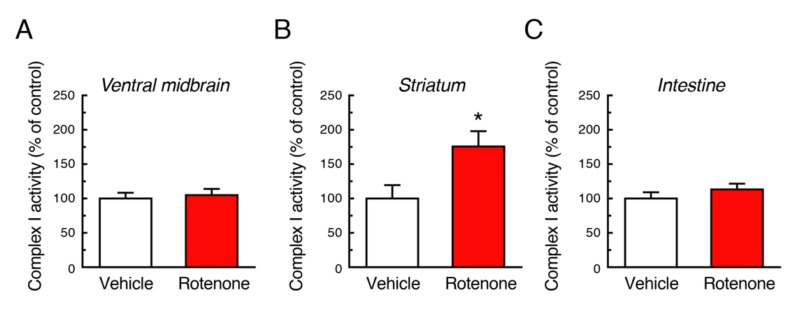
Figure 10.
Changes in mitochondrial complex I activity after chronic exposure to low-dose rotenone in mice. Complex I activity was measured in the ventral midbrain (A), striatum (B) and intestine (C) 4 weeks after rotenone treatment. Each value is the mean ± SEM (Vehicle: n = 4; Rotenone: n = 5). * p < 0.05 vs. the vehicle-treated control group (two-tailed unpaired independent t-test).

