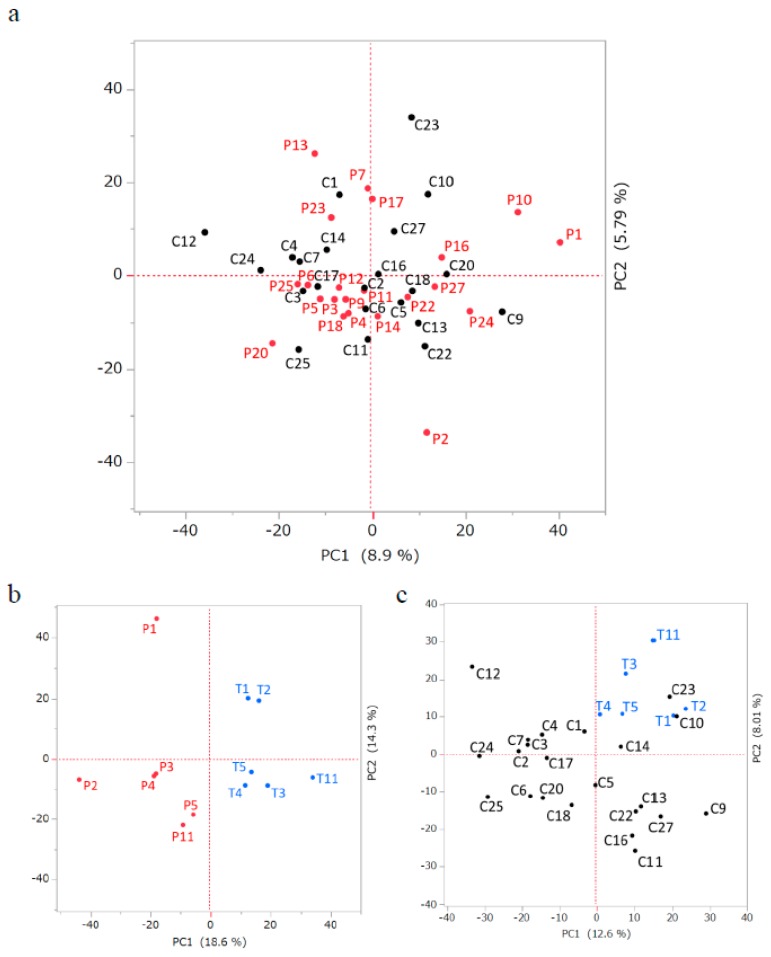
Figure 2.
Principal component analysis of miRNA expression levels in each group comparison after exclusion of outlier data. The X and Y axes represent the first and the second principal components with contribution ratios in percentages. Control and patient groups (a), patient and treated group (b), and control and treated groups (c). “C”, “P”, or “T” with numbers indicate the samples in each group.

