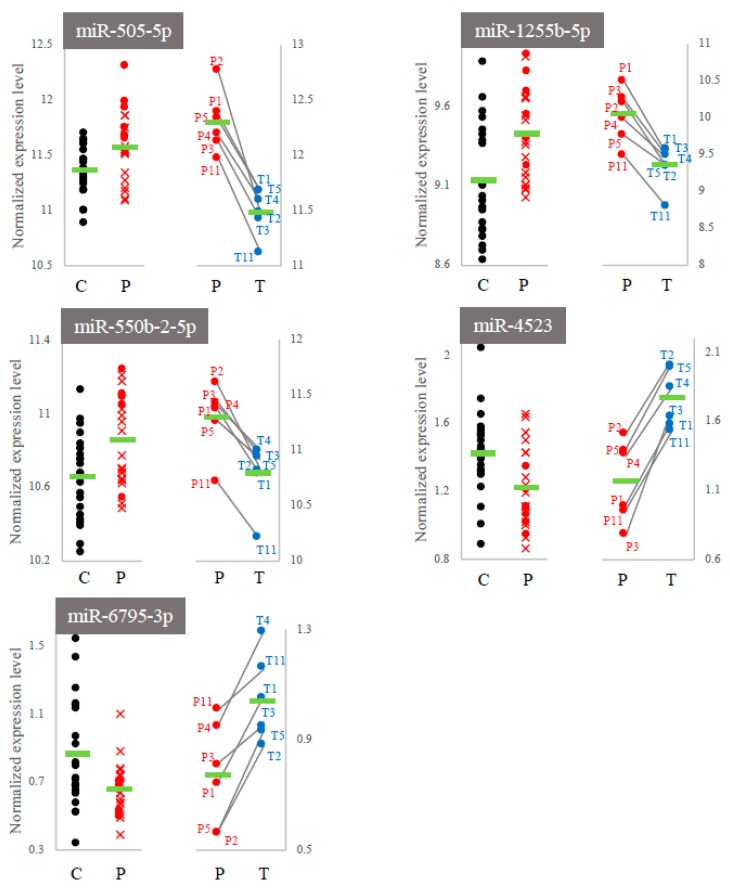
Figure 5.
The expression levels of five common miRNAs within each experimental comparison. C and P: control group vs. patient group; P and T: patient group vs. treated group. The expression levels in the P-group were differentially represented due to differences in the normalization processes (Section 4).

