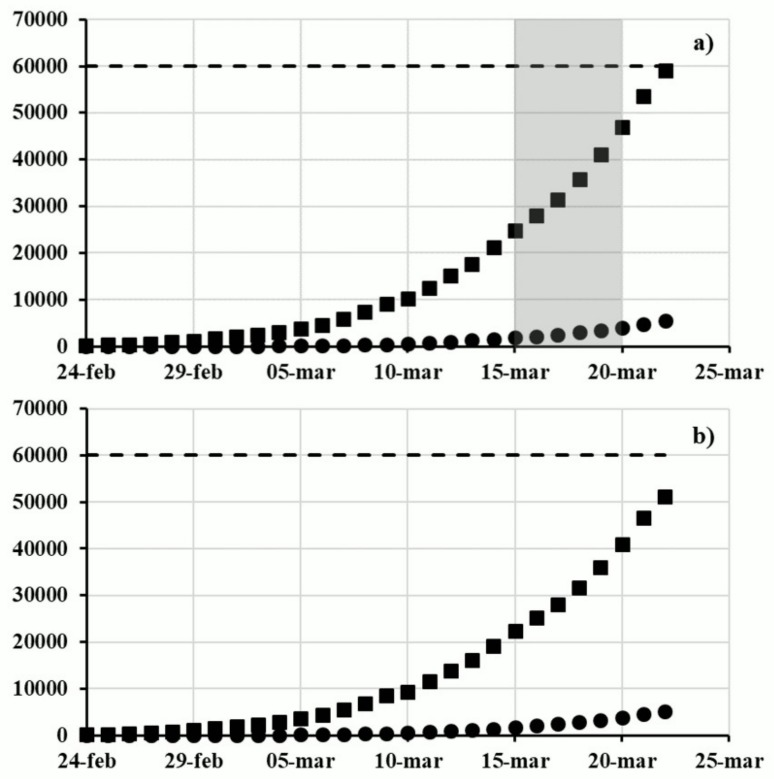
Figure 1.
Cumulative trend of the number of infected people (■) and death (●) in (a) Italy and in (b) the more affected Italian regions. Dashed line represents the 0.1% of the Italian population. The highlighted area represents the period of the questionnaire administration (Data from the Italian Civil Protection Department: https://github.com/pcm-dpc/COVID-19—last access: April 27, 2020).

