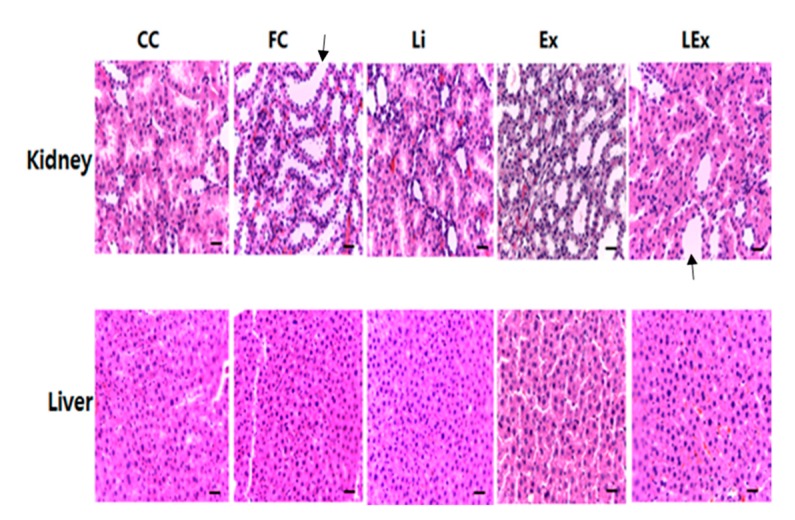
Figure 1.
Hematoxylin and eosin staining in kidney and liver tissue. (Histological changes were evaluated in nonconsecutive histological fields, randomly chosen at a magnification of 100×. Scale bar, 100 μm; black arrow indicates a normal state that cannot confirm the degeneration of the tubule in kidney).

