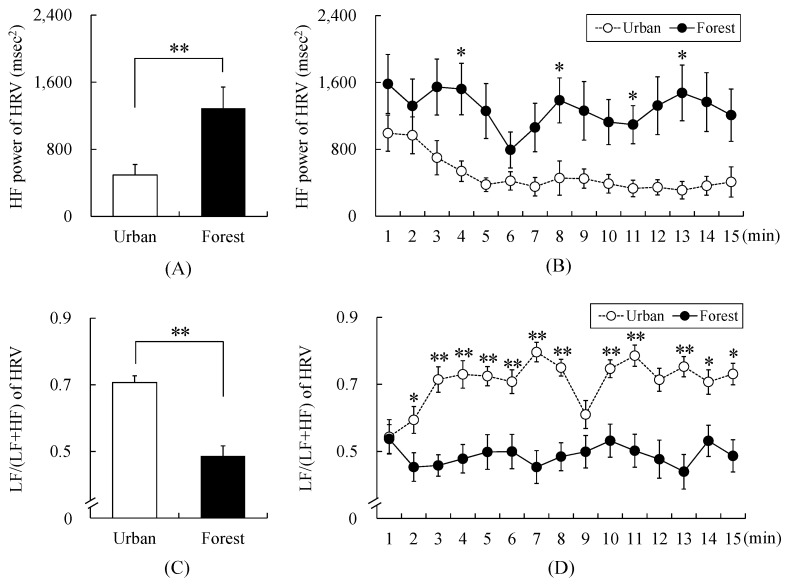
Figure 3.
Change in heart rate variability (HRV) while walking in the forest and urban areas. (A) Change in high-frequency (HF) power while walking in the forest and urban areas, (B) Temporal changes in HF power while walking in the forest and urban areas, (C) Change in the low-frequency (LF)/(LF + HF) power while walking in the forest and urban areas, (D) Temporal changes in the LF/(LF + HF) value while walking in the forest and urban areas. Data are presented as mean ± standard error. Significant differences verified by paired t-test with Holm’s correction was used; * p < 0.05 and ** p < 0.01.

