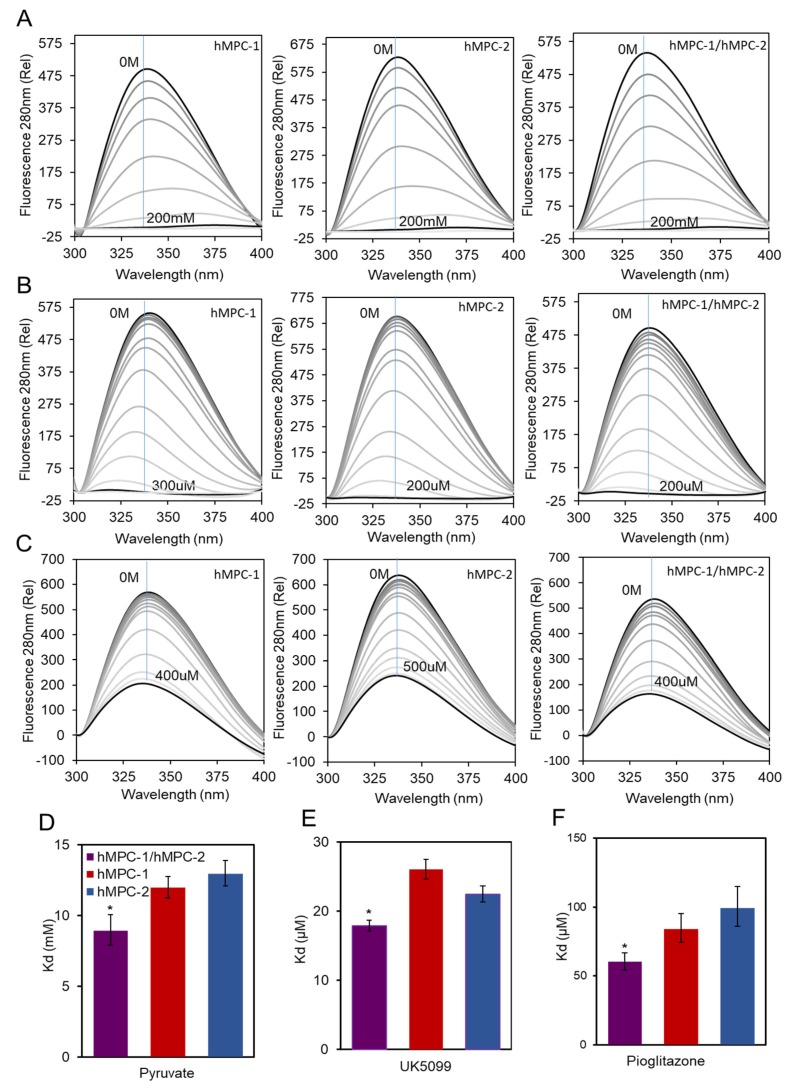
Figure 4.
Molecular interaction of hMPCs with substrates and inhibitors. Fluorescence spectrum of the hMPC-1, hMPC-2, and hMPC-1/hMPC-2 on the titrating of (A) pyruvate up to 200 mM, (B) UK6099 up to 200 or 300 µM, and (C) pioglitazone up to 400 or 500 µM. The blue line indicates the intensity values in the 338nm wavelength of each spectrum used for calculating the dissociation constants. The equilibrium dissociation constants (Kd) of hMPCs were calculated using a fluorescence quenching assay with (D) pyruvate, (E) UK6099, and (F) pioglitazone. The Kd values for hMPC-1 (red), hMPC-2 (blue), and hMPC-1/hMPC-2 (purple) for each ligand are summarized in Table S1. Errors were determined based on three replicated experiments. The error bars represent the standard deviation (SD), n = 3. * p = 0.05.

